
Chartbrew
Connect databases, APIs, and analytics tools to create reusable datasets and live dashboards for revenue, signups, and usage tracking. Share insights with teams or clients effortlessly.



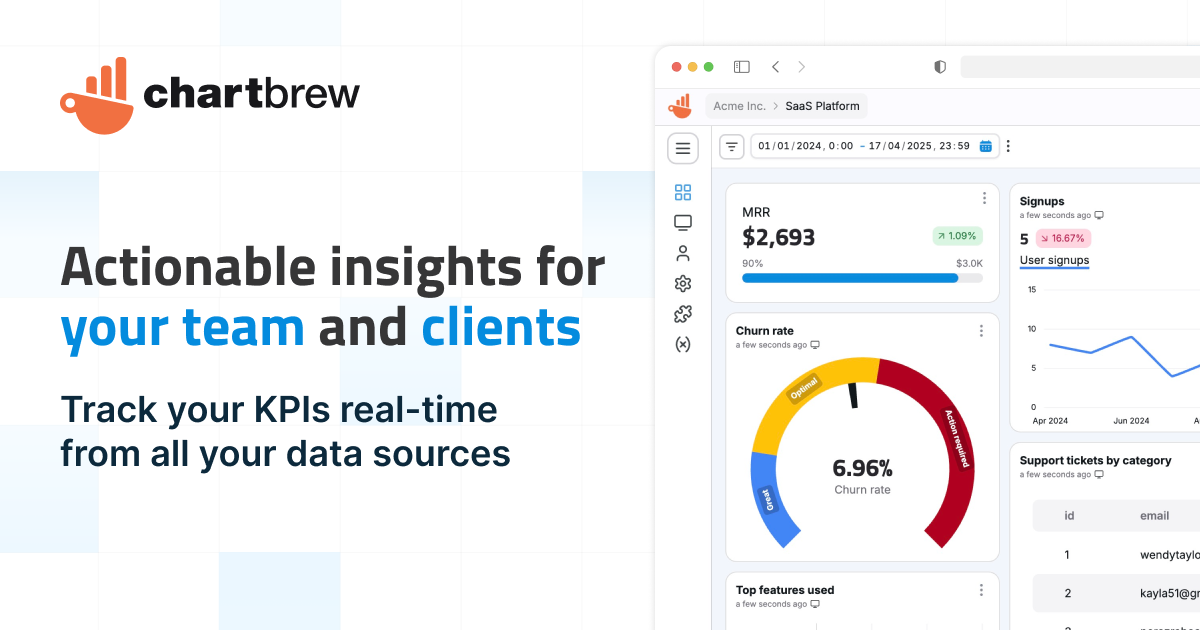
Chartbrew is a self-hostable platform for building live KPI dashboards from your existing data sources. Whether you're tracking internal metrics or sharing client-facing reports, Chartbrew streamlines the process with reusable datasets, AI-assisted setup, and automated sharing.
Key Features
- Multi-source data connection: Pull data from databases (Postgres, MySQL, MongoDB), APIs (Stripe, Google Analytics, Plausible), and analytics tools into a single platform.
- Reusable datasets: Create and reuse datasets across charts and dashboards, with support for joining data from multiple sources.
- Live KPI dashboards: Build customizable dashboards with charts, tables, goals, and filters to track business health at a glance.
- AI-assisted setup: Get help writing SQL queries, building datasets, and exploring data without starting from scratch.
- Automated reporting: Schedule chart refreshes, send snapshots via email or Slack, and trigger alerts through webhooks.
- Secure sharing: Share dashboards internally, embed them in products, or provide controlled client access with granular permissions.
- Self-hosting option: Deploy Chartbrew on your own infrastructure for full data control and customization.
- Enterprise-ready: Used by product teams, SaaS companies, and agencies for both internal and client-facing reporting.
Tech / Self-Hosting
Chartbrew is built with Node.js and React, offering both cloud-hosted and self-hosted options. The self-hosted version provides full control over data and infrastructure, making it ideal for privacy-conscious teams. The platform supports PostgreSQL, MySQL, and MongoDB for dataset storage and offers integrations with popular data sources like Stripe, Google Analytics, and Supabase.
View documentation for deployment guides and API references.