23 Best Open Source New Relic Alternatives
A curated collection of the 23 best open source and self-hosted alternatives to New Relic in 2026.
Looking for a free, privacy-friendly, or self-hosted replacement for New Relic in 2026? The top open-source alternative is Grafana — Grafana unifies metrics, logs, traces, profiles, and business data into one OpenTelemetry-native platform with AI-assisted root cause analysis and adaptive cost controls..
Other highly rated open-source New Relic alternatives include NetData, Prometheus and SigNoz.
Grafana unifies metrics, logs, traces, profiles, and business data into one OpenTelemetry-native platform with AI-assisted root cause analysis and adaptive cost controls.
Grafana unifies metrics, logs, traces, profiles, and business data into one OpenTelemetry-native platform with AI-assisted root cause analysis and adaptive cost controls.

Real-time infrastructure monitoring with AI troubleshooting
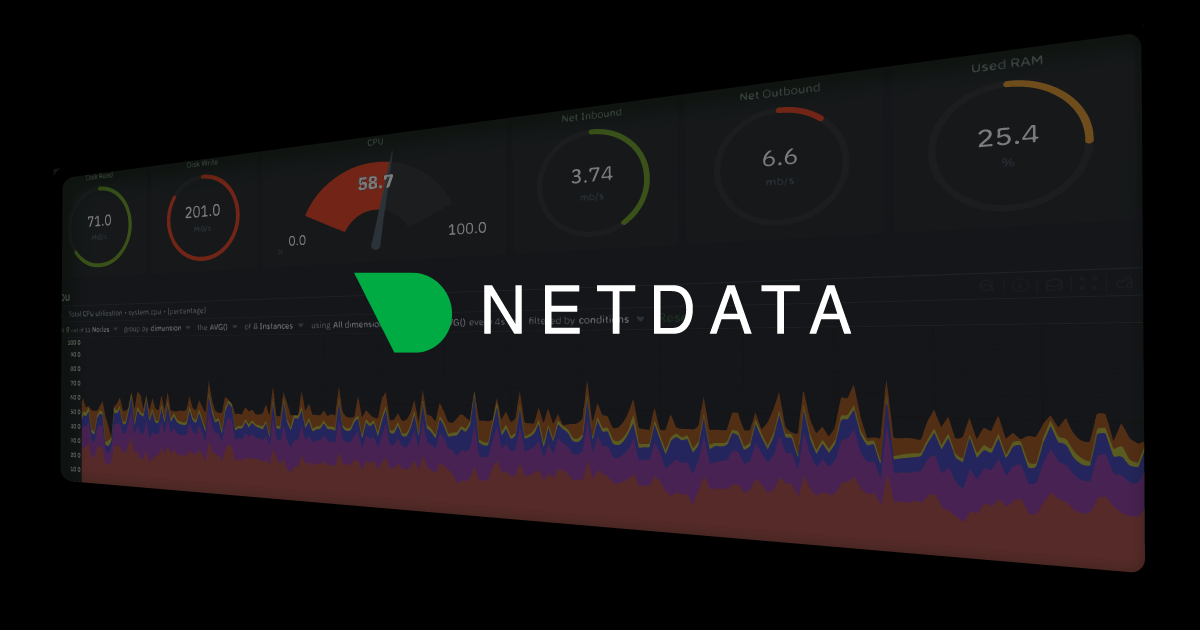
Netdata is a real-time infrastructure monitoring solution designed to transform how teams observe, troubleshoot, and optimize their systems. With per-second metrics collection, unsupervised machine learning for anomaly detection, and AI-driven troubleshooting capabilities, Netdata provides actionable insights to reduce downtime and improve system performance. - Per-second metrics collection for granular system visibility - Unsupervised ML anomaly detection with automatic alerting - AI Co-Engineer for intelligent troubleshooting and root cause analysis - Anomaly Advisor to identify and explain performance issues - Blast Radius Detection to pinpoint affected system components - Zero-configuration deployment with algorithmic dashboards - Distributed observability pipeline for scalable monitoring - Edge computing support for distributed environments - Tiered retention with infinite scalability - eBPF monitoring for deep system-level insights - OpenTelemetry integration for standardized observability - Real-time network monitoring with topology visualization - Custom dashboards without requiring query languages - Mobile apps for monitoring on-the-go - Enterprise access control and zero-code instrumentation Netdata is open-source and can be self-hosted on Linux systems. The platform supports both cloud-based and on-premises deployments, with options for Netdata Agents, Netdata Parents, and Netdata Cloud. The software is designed for extreme cardinality handling and real-time performance at scale, making it suitable for large-scale infrastructure monitoring.

Open-source monitoring & time series database

Prometheus is an open-source monitoring system and time series database designed for cloud-native environments. It provides a flexible dimensional data model, a powerful PromQL query language, and efficient alerting mechanisms. - Dimensional data model: Identifies time series by metric names and key-value pairs for flexible data organization. - PromQL query language: Enables powerful querying, correlation, and transformation of time series data for visualizations and alerts. - Precise alerting: Uses Alertmanager to handle notifications and silencing based on PromQL rules. - Simple operation: Operates independently with local storage, deployable as statically linked binaries across environments. - Instrumentation libraries: Offers official and community-contributed libraries for metrics instrumentation in major languages. - Ubiquitous integrations: Includes hundreds of official and community integrations for extracting metrics from existing systems. - Cloud-native integration: Works seamlessly with Kubernetes and other cloud/container managers for continuous service discovery and monitoring. - Open governance: A CNCF graduated project with 100% open-source components under the Apache 2 License. Prometheus is 100% open-source and self-hostable, with all components available under the Apache 2 License. It is developed in Go and designed for easy deployment across various environments, including Kubernetes and cloud infrastructures. The system operates independently with local storage, ensuring minimal external dependencies.

Open-source Datadog alternative for full-stack observability
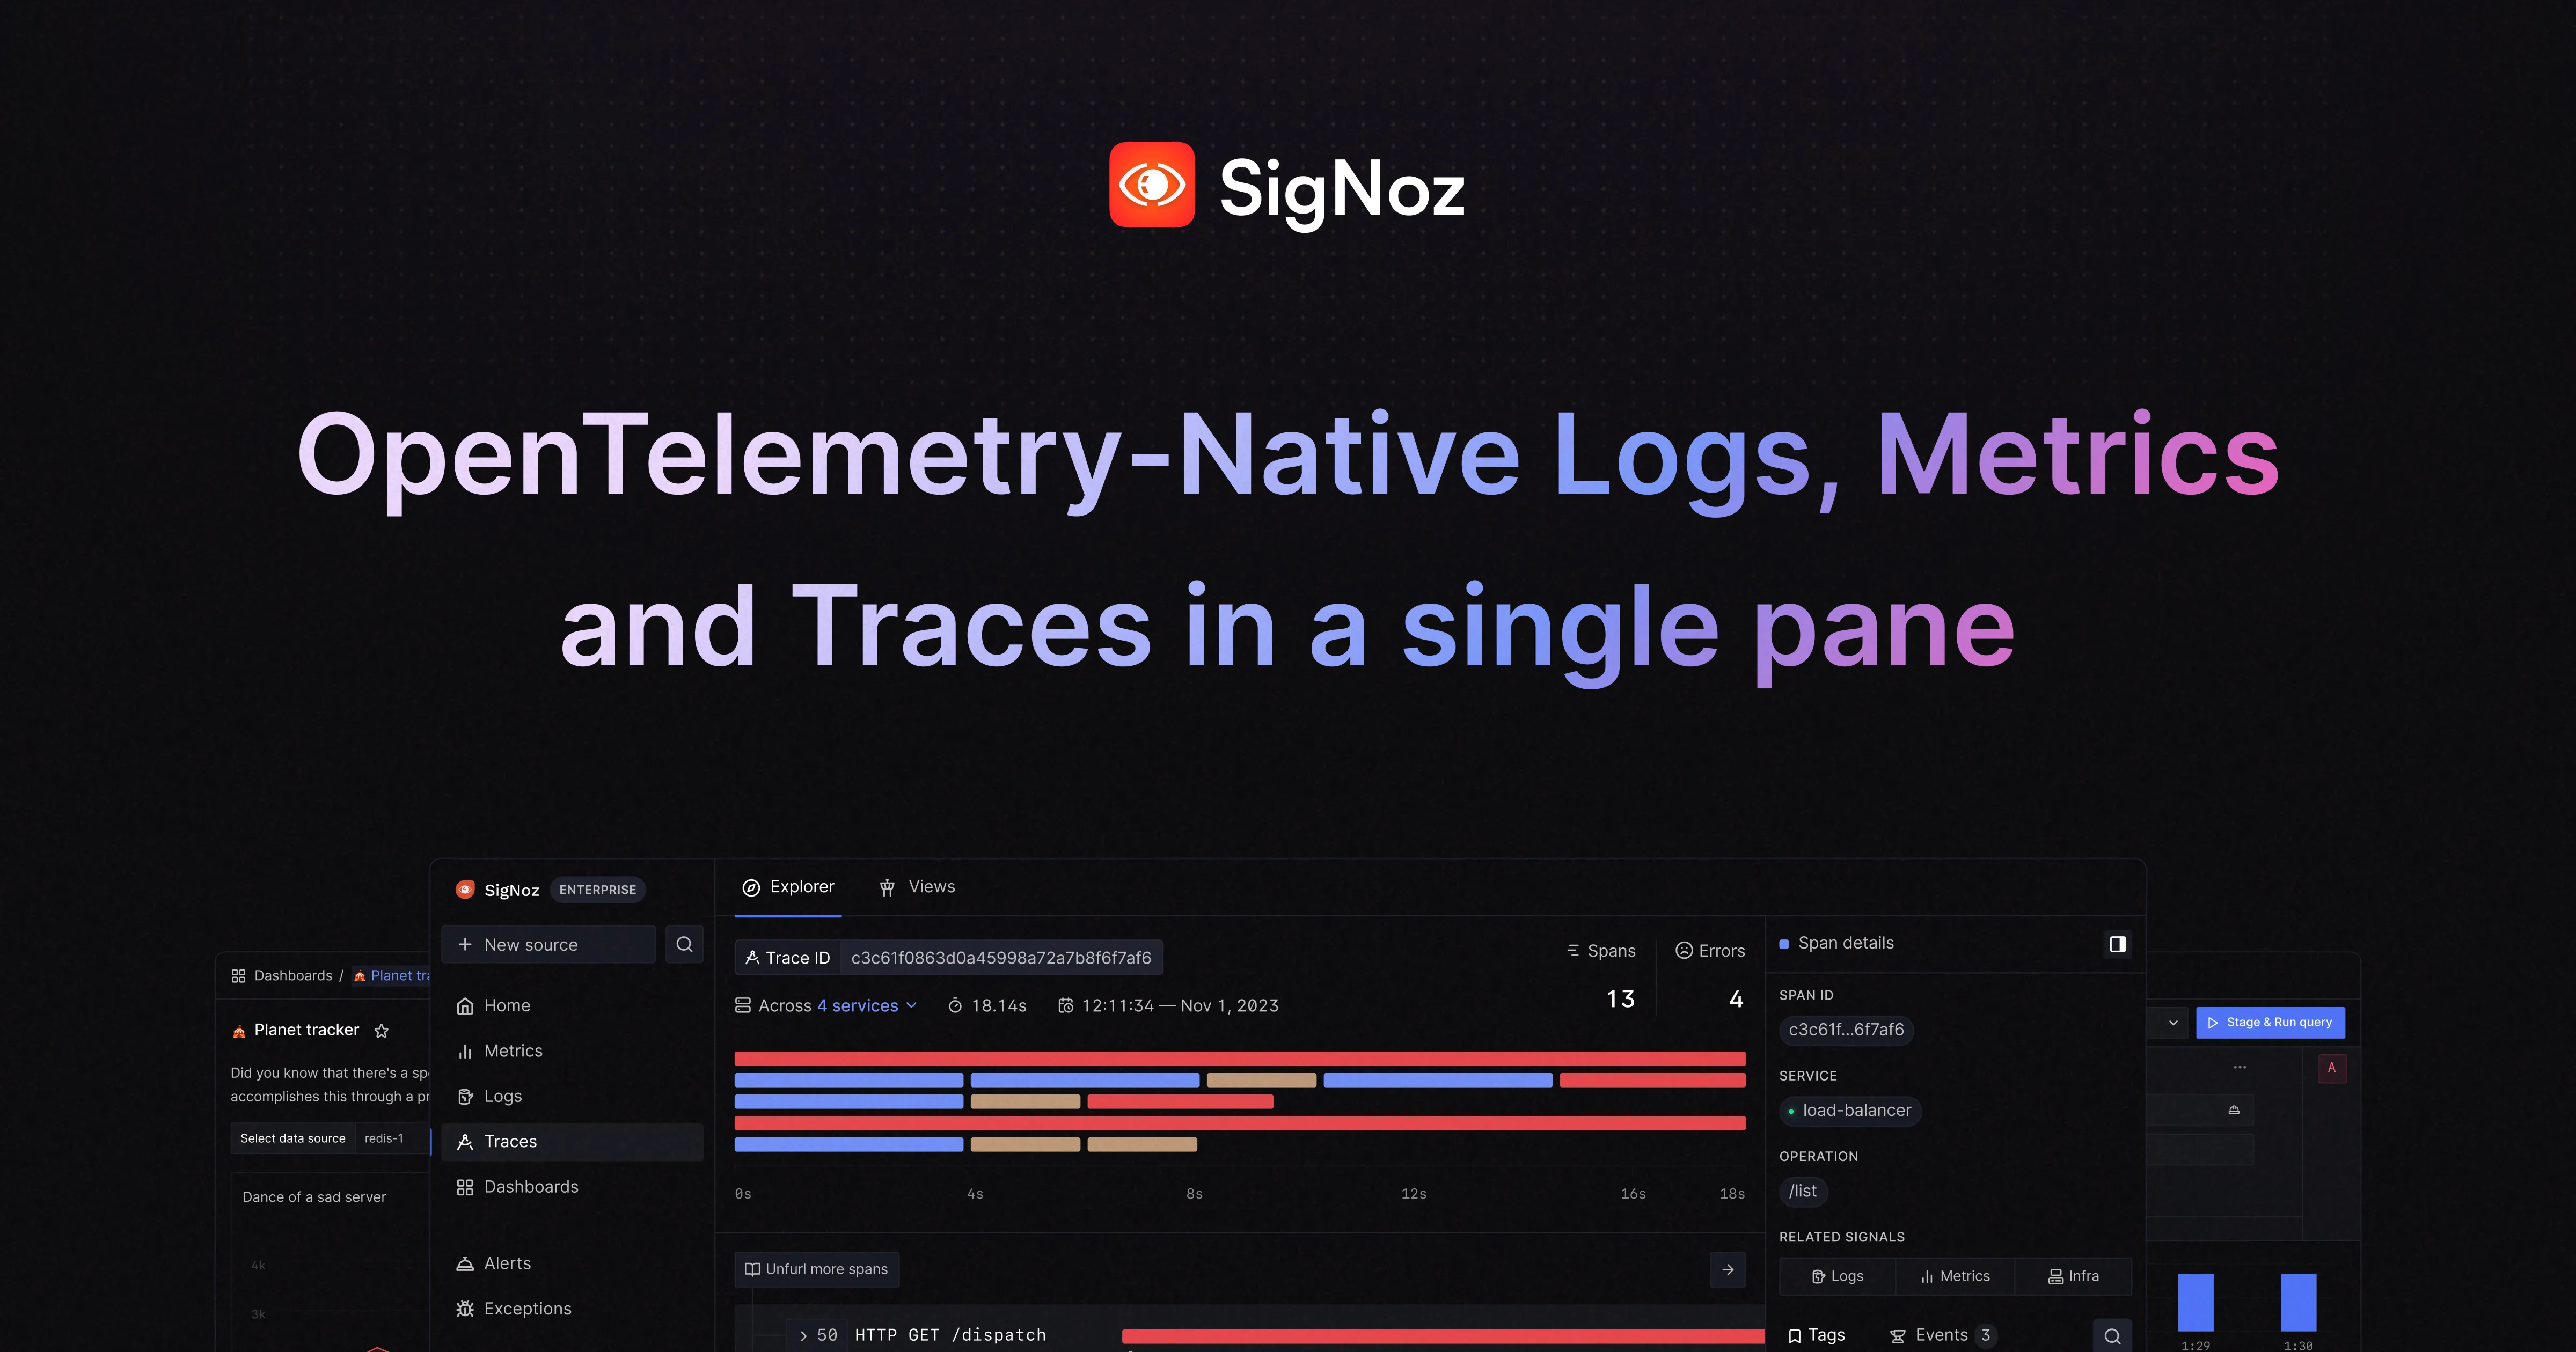
SigNoz is a modern observability platform designed to simplify monitoring, logging, and tracing for applications and AI agents. Built on open standards like OpenTelemetry, it consolidates APM, logs, metrics, exceptions, and AI observability into a single tool. - Full-Stack Observability: Monitor traces, metrics, logs, and exceptions in one platform - OpenTelemetry Native: Built on OpenTelemetry standards for vendor-neutral instrumentation - AI Observability: Specialized tools for monitoring AI agents and applications - Real-Time Alerts: Configurable alerting for anomalies and critical events - Unified Dashboard: Single interface for all observability data - Usage-Based Pricing: Simple, predictable pricing model - Self-Hosting: Deploy on your own infrastructure with Self-Hosted SigNoz - Agent-Native: Optimized for monitoring AI agents and their workflows SigNoz offers both cloud-hosted and self-hosted options. The self-hosted version can be deployed using Docker, Kubernetes, or Helm charts. It supports various data sources and integrates seamlessly with existing monitoring setups. The platform is designed for scalability and can handle high-volume telemetry data from distributed systems.

AI-powered security testing for continuously shipped software
Neo applies reasoning, memory, and real execution across the delivery lifecycle — so security keeps up with continuously shipped software. From the creators of Nuclei, trusted by over 100,000 security professionals. - Continuous Testing: Maps and tests all exposed assets (domains, APIs, endpoints, ports, cloud services) in real-time as infrastructure changes - Parallel Layer Testing: Specialist workflows test applications, APIs, code, and infrastructure simultaneously, drawing context from code, tickets, and past findings - Verified Findings: Every issue is reproduced before reporting, with exploitable vulnerabilities routed directly to engineering teams - Memory & Learning: Each run deepens the map of your codebase, dismissed false positives stay dismissed, and new community detections are integrated daily - Community-Powered Coverage: Tracks new CVEs, CISA KEVs, public exploits, and internet exposure for fastest detection of emerging threats - Benchmark Accuracy: Achieves 3x more critical findings with 5x fewer false positives compared to traditional scanners - Triage Efficiency: Cuts triage time by 95% and enables 3x faster remediation - Real-Time Discovery: Provides continuous monitoring of every domain, API, and endpoint - Open Source Foundation: Built on Nuclei and other open-source tools from ProjectDiscovery - Cloud & Self-Hosted Options: Available via ProjectDiscovery Cloud or self-hosted deployments - Integration Ready: Connects with existing security workflows, ticketing systems, and development pipelines - Documentation: Comprehensive guides available at docs.neo.projectdiscovery.io Neo is designed for offensive security teams running security as infrastructure, with AI specifically engineered for security workflows rather than general-purpose applications.
Open-source session replay and product analytics platform you can self-host for complete control over data security, privacy, and compliance.
Open-source session replay and product analytics platform you can self-host for complete control over data security, privacy, and compliance.

Open source observability platform for logs, traces and errors
HyperDX is an open source observability platform designed to help engineering teams resolve production issues faster. It unifies session replays, logs, traces, metrics, and errors into a single interface, eliminating the need for multiple tools. - End-to-End Tracing: Automatically trace requests from browser to backend servers and async workers - Blazing Fast Search: Search terabytes of events in seconds using ClickHouse - Intuitive Search Syntax: Simple full-text search without complex syntax requirements - Automatic Pattern Clustering: Aggregate log patterns and condense billions of events into distinctive clusters - Correlated Session Replays: Link session replays with backend logs and traces automatically - Visualization Tools: Build and share intuitive charts for logs, metrics, and traces - Automatic Instrumentation: Trace logs, API requests, DB queries with minimal code - Alerts & Notifications: Get notified via Slack, Email, or PagerDuty when issues occur - Intercom Integration: Jump directly from Intercom to user sessions and logs - Live Tail: View and search log streams in real-time - Native JSON Parsing: Search and graph structured JSON logs without configuration - Vendor Agnostic: Powered by OpenTelemetry for no vendor lock-in - Agent-Free Install: No additional agents, sidecars, or containers required HyperDX is built on ClickHouse and OpenTelemetry, making it highly scalable and compatible with various deployment environments. The platform offers both cloud-hosted and self-hosted options, with automatic instrumentation supporting multiple languages including Node.js, Python, Java, Go, Elixir, and React Native. Deployment is supported on Kubernetes, AWS EC2, Vercel, Fly.io, Heroku, and Cloudflare.
Comprehensive monitoring solution offering error tracking, session replay, and performance insights for seamless debugging and optimization.
Comprehensive monitoring solution offering error tracking, session replay, and performance insights for seamless debugging and optimization.

Open-source observability for LLMs with OpenTelemetry
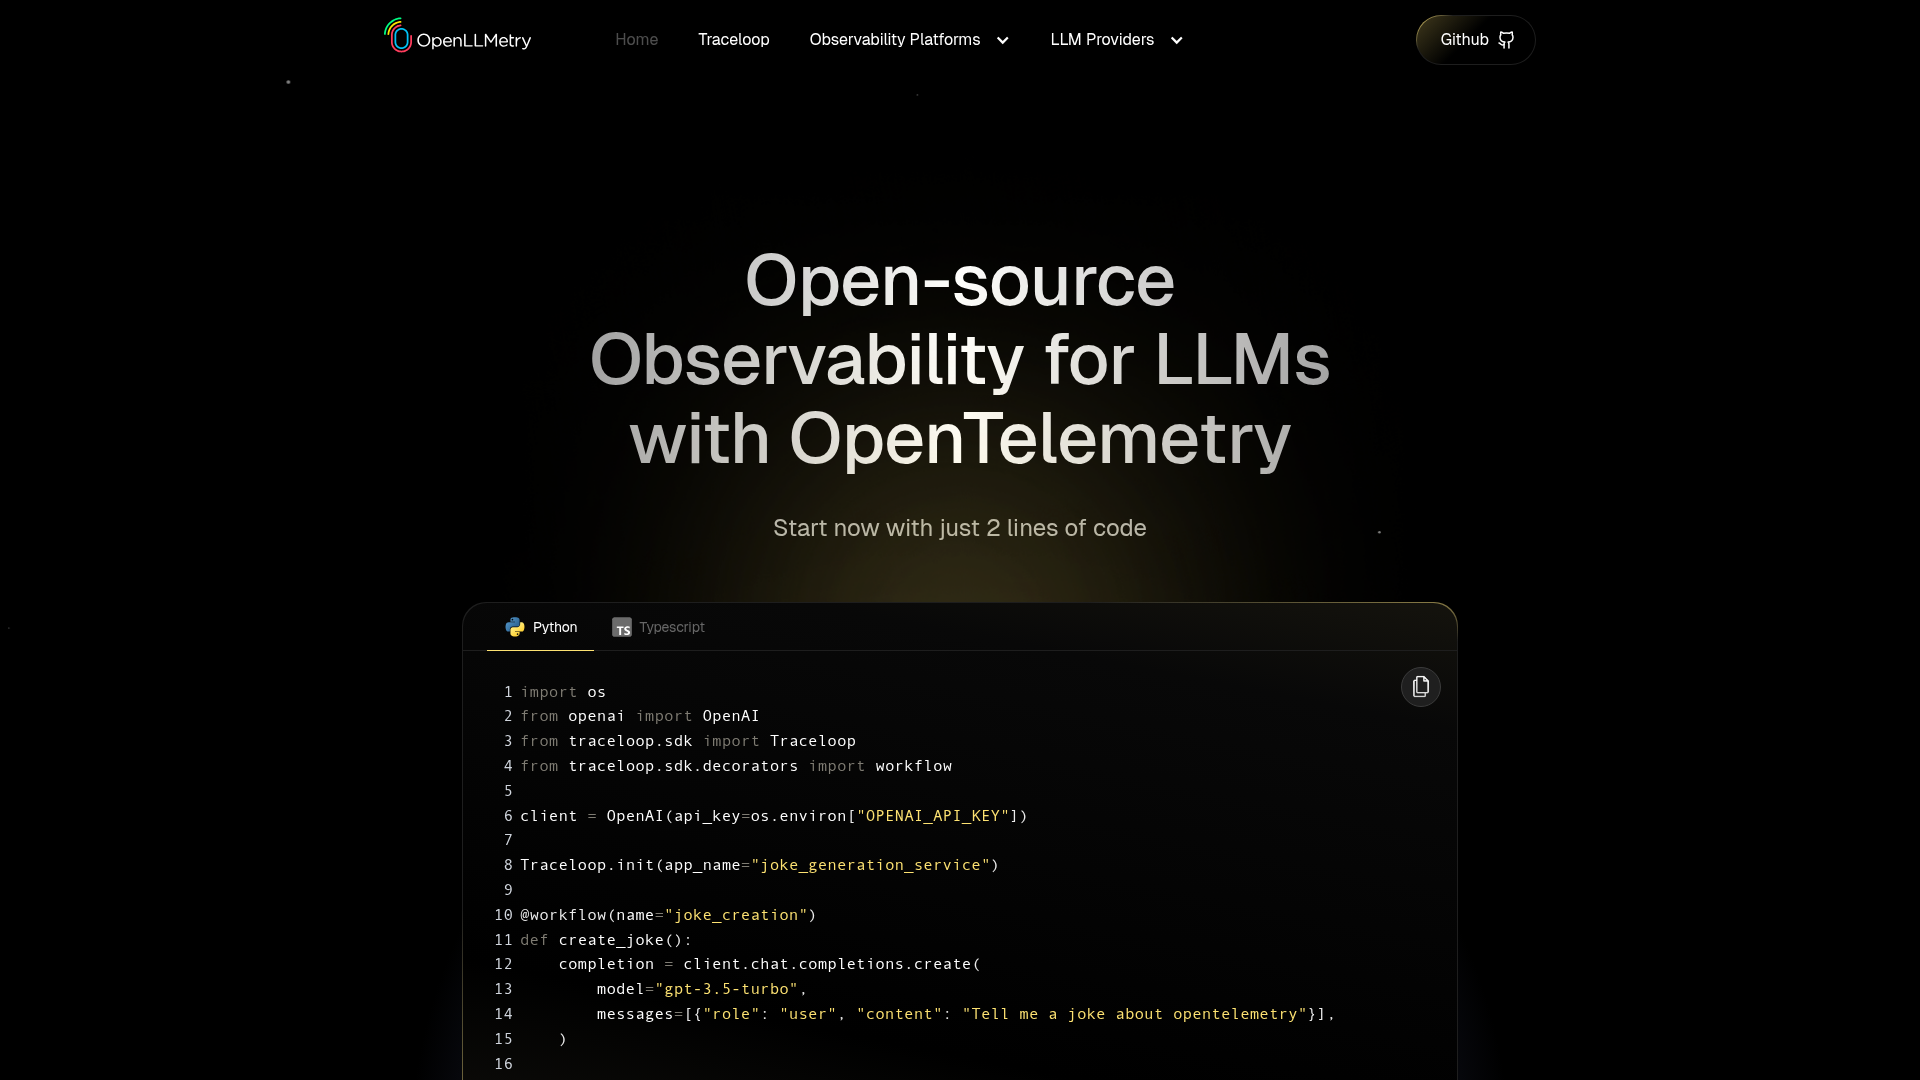
OpenLLMetry is an open-source observability platform designed specifically for Large Language Model (LLM) applications. It provides comprehensive tracking, monitoring, and debugging capabilities using the OpenTelemetry standard, enabling developers to gain deep insights into their LLM workflows. - LLM-Specific Instrumentation: Automatically captures and traces LLM interactions, including prompts, completions, and tool usage - OpenTelemetry Integration: Seamlessly integrates with existing OpenTelemetry-based observability stacks - Multi-Provider Support: Works with major LLM providers including OpenAI, Anthropic, Mistral AI, Cohere, and more - Multi-Platform Compatibility: Supports Python and TypeScript implementations - Trace Visualization: Provides detailed trace views for debugging complex LLM workflows - Performance Monitoring: Tracks latency, token usage, and error rates across LLM calls - Cost Optimization: Helps identify expensive LLM operations and optimize usage - Extensible Architecture: Modular design allows for custom instrumentation and extensions OpenLLMetry is open-source software that can be self-hosted. The project provides comprehensive documentation for deployment and configuration. It requires an OpenTelemetry-compatible backend for storing and visualizing traces, with support for popular platforms like Instana, Dynatrace, Grafana Tempo, Honeycomb, New Relic, Datadog, and Splunk.

eBPF-powered AI observability platform
Coroot is an eBPF-powered and AI-guided observability platform designed to provide full-stack visibility with minimal setup. It automatically collects metrics, logs, traces, and profiles across your entire infrastructure—from applications and databases to cloud and network layers—without requiring any code changes. - AI-Powered Root Cause Analysis: Instantly identifies and explains issues using complete telemetry data, acting like an experienced engineer to trace dependencies and suggest fixes. - Zero-Code Setup: Deploys with no instrumentation or configuration changes, leveraging eBPF for automatic data collection. - Full-Stack Visibility: Monitors applications, databases (PostgreSQL, MongoDB), Kubernetes, cloud services, and network components in a unified view. - Continuous Profiling: Captures performance profiles to identify bottlenecks and optimize resource usage. - Service Mapping: Visualizes service dependencies and interactions to simplify troubleshooting. - OpenTelemetry Integration: Supports OpenTelemetry standards for seamless data ingestion and compatibility. - Alerting & Insights: Converts raw telemetry into actionable alerts and recommendations. - Enterprise Edition: Offers advanced features for large-scale deployments, including enhanced security and scalability. Coroot is open-source and can be self-hosted using Docker or Kubernetes. The platform is designed for ease of deployment, with pre-built images and Helm charts available for quick setup. It supports integration with existing observability stacks and adheres to open standards like OpenTelemetry. For more details, visit the documentation or explore the GitHub repository.
Cloud-native observability database unifying metrics, logs, and traces with sub-second queries, 50x cost reduction, and seamless OpenTelemetry integration.
Cloud-native observability database unifying metrics, logs, and traces with sub-second queries, 50x cost reduction, and seamless OpenTelemetry integration.

Open-source LLM observability and monitoring platform
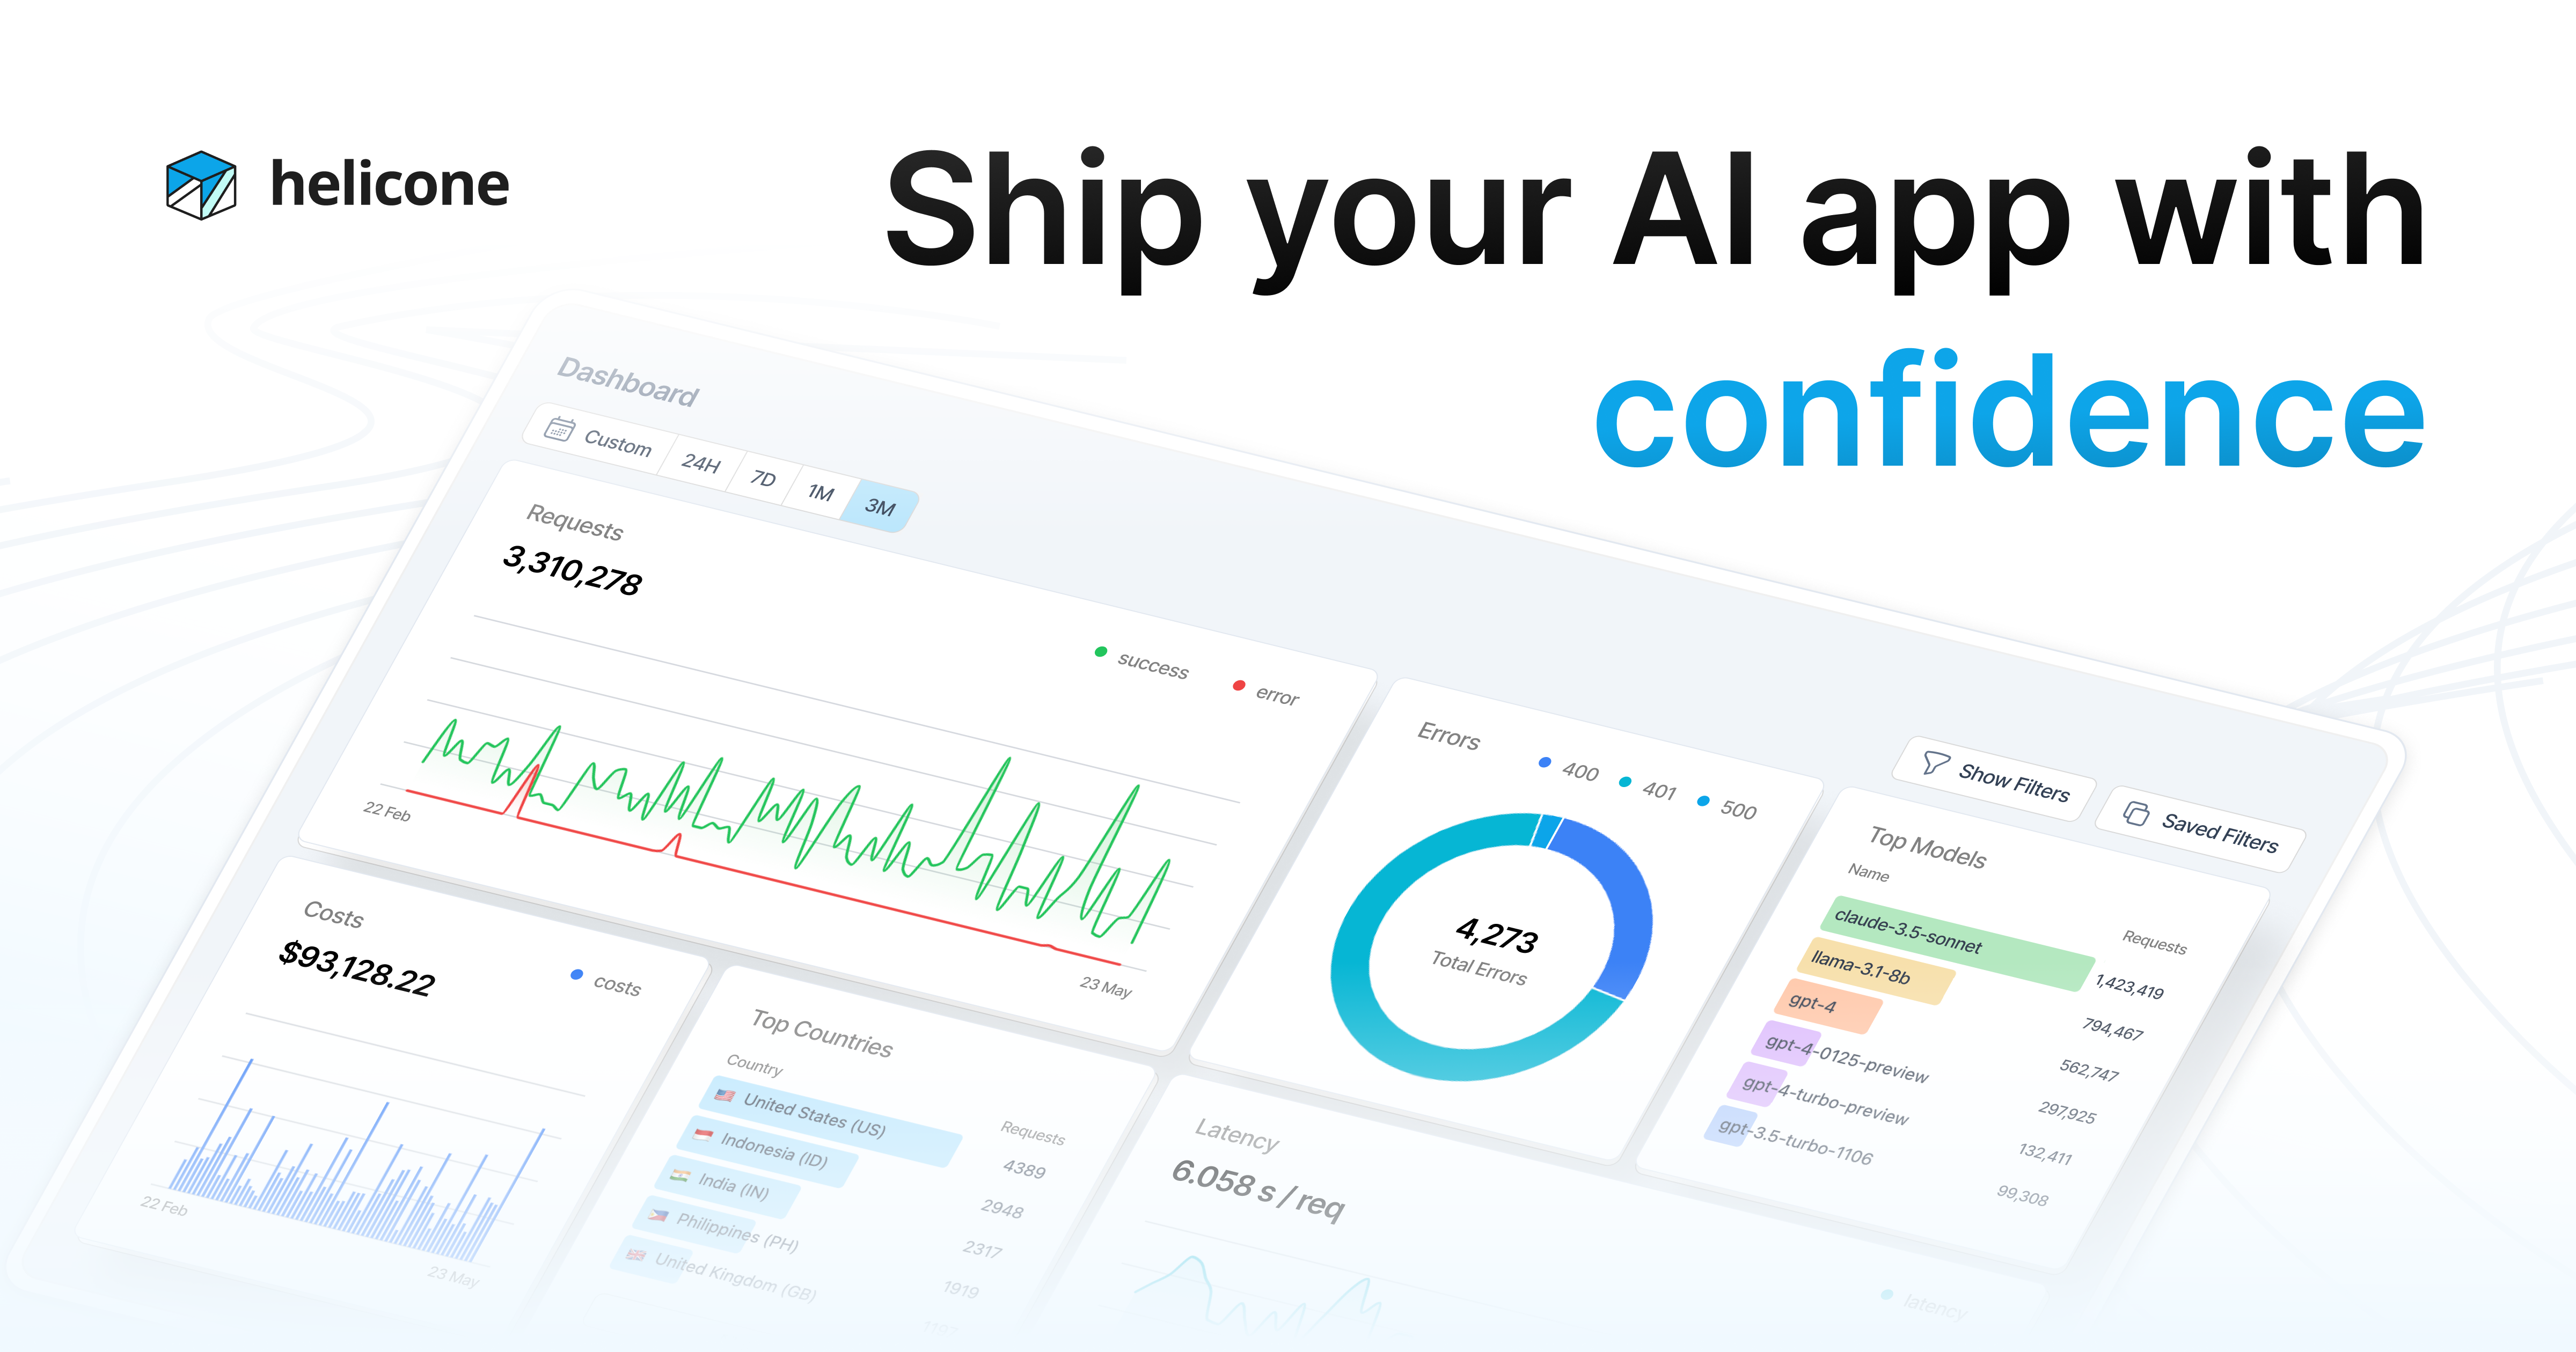
Helicone is the LLMOps platform powering the fastest-growing AI companies. It enables developers to route, debug, and analyze their AI applications with real-time observability, monitoring, and analytics. - LLM Observability: Real-time monitoring and debugging of LLM interactions. - AI Gateway: Route requests to multiple LLM providers seamlessly. - Analytics Dashboard: Track performance, usage, and costs across models. - Prompt Management: Store, version, and optimize AI prompts. - Rate Limiting & Alerts: Prevent abuse and get notified of anomalies. - Multi-Provider Support: Integrate with OpenAI, Anthropic, Azure, and more. - HQL (Helicone Query Language): Query and analyze AI interactions efficiently. - Datasets & Playground: Test and refine AI models with interactive tools. Helicone is open-source and can be self-hosted. It supports integration with major LLM providers and offers a cloud-based solution for ease of use. The platform is designed for scalability and reliability, making it suitable for both small projects and enterprise-level AI applications.

AI observability platform for LLMs and apps
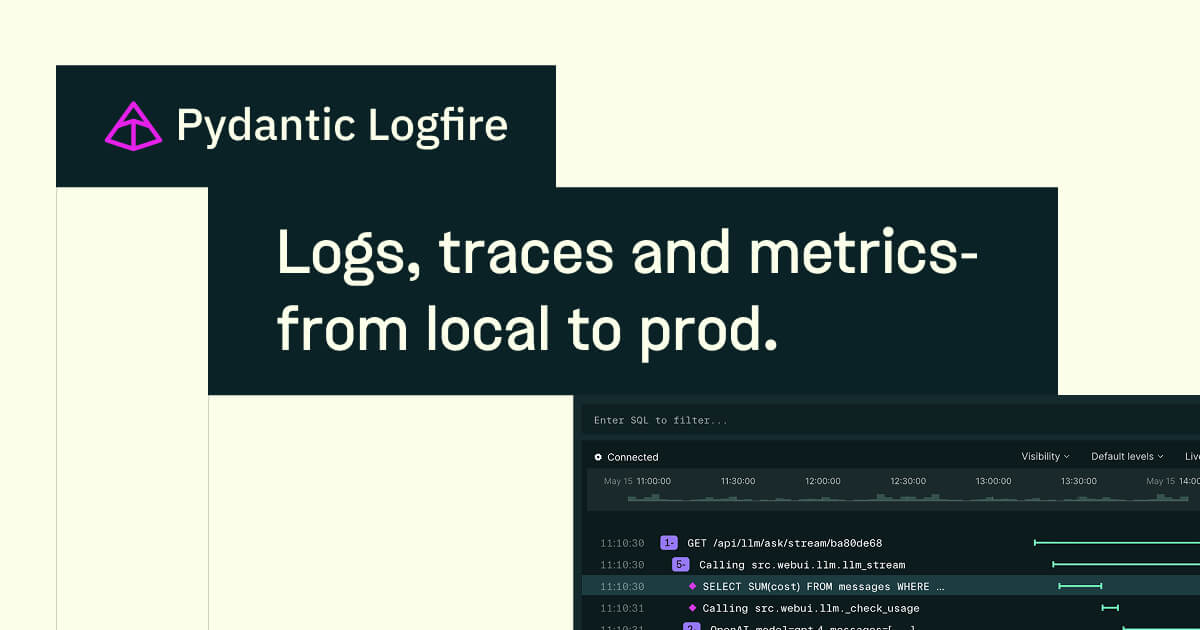
Pydantic Logfire is a production-grade observability platform designed specifically for AI applications, agents, APIs, and databases. Built on OpenTelemetry, it provides comprehensive monitoring across your entire stack, not just LLM calls. - Whole-App Tracing: Trace model calls, agent steps, API requests, and database queries in a single timeline - Multi-Language Support: SDKs for Python, JavaScript/TypeScript, and Rust with OpenTelemetry compatibility for other languages - Evals & Scoring: Built-in evaluation framework that runs alongside your application logic - Cost Tracking: Monitor and optimize AI application costs in real-time - PII Scrubbing: Automatic sensitive data redaction in SDKs - Postgres-Flavored SQL: Query spans directly using familiar SQL syntax - Live Debugging: Real-time monitoring of production services with error rates, latency, and traces - Self-Hosting Option: Deployable on your own infrastructure - OpenTelemetry Foundation: Built on industry-standard observability protocols - Self-Hosted Deployment: Available for on-premises or private cloud deployments - Compliance: SOC 2 Type II, HIPAA, and EU data residency compliant - Integration: Seamless integration with existing monitoring and logging systems

OpenTelemetry-native observability platform
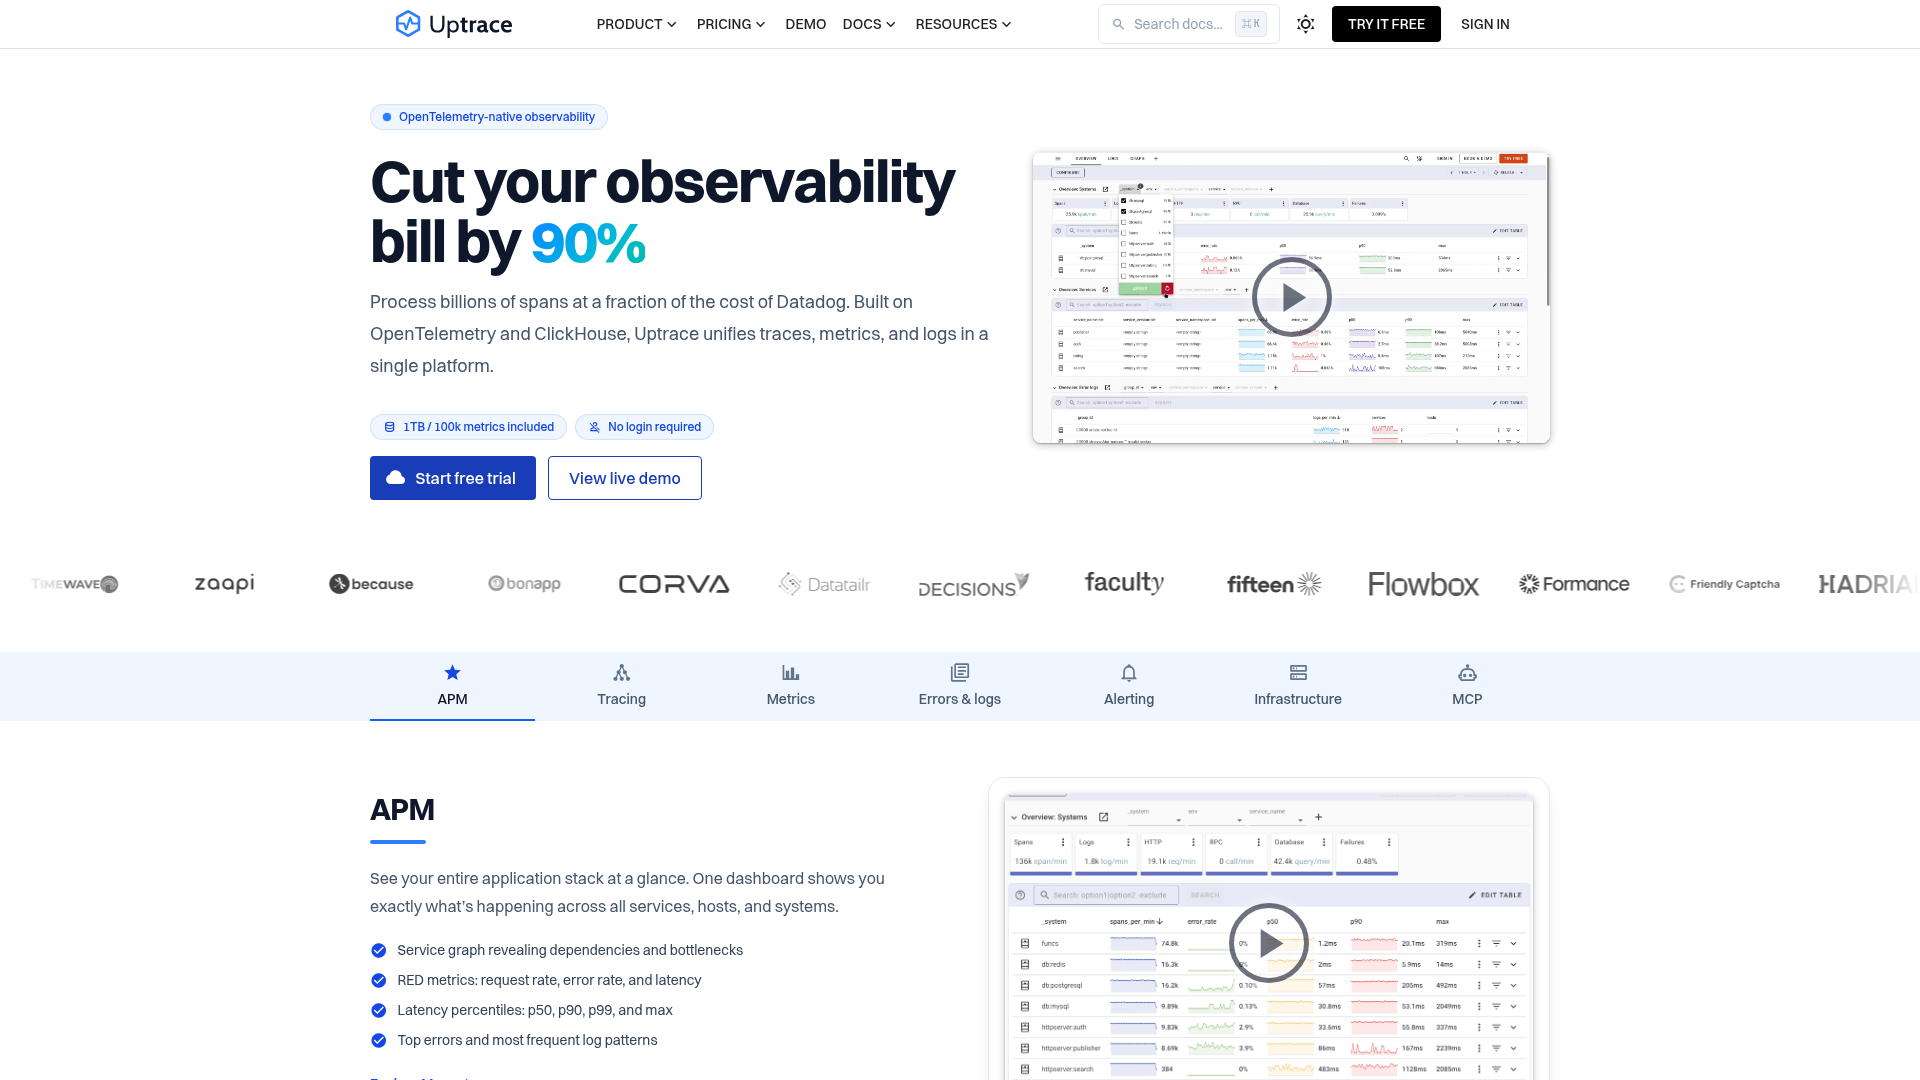
Uptrace is an OpenTelemetry-native observability platform that unifies traces, metrics, and logs in a single platform. Built on OpenTelemetry and ClickHouse, it processes billions of spans at a fraction of the cost of traditional observability tools like Datadog or New Relic. - All-in-one observability: Unified platform for traces, metrics, and logs with no need to stitch data together manually. - OpenTelemetry-native: Ingest data from OpenTelemetry, Prometheus, Vector, FluentBit, CloudWatch, and more. - Cost-effective pricing: Pay per GB ingested and active timeseries with no per-seat fees or hidden charges. - Self-hosting: Download from GitHub and own your data completely with no feature limits. - APM & Infrastructure Monitoring: Service graphs, RED metrics, latency percentiles, and top errors with infrastructure monitoring capabilities. - Alerting & MCP: Built-in alerting and MCP (Model Context Protocol) support for AI-driven observability. - Predictable pricing: Set monthly caps to avoid billing surprises and budget effectively. - Compliance-ready: Offers on-premise installations for organizations with strict compliance requirements. Uptrace is built on OpenTelemetry and ClickHouse, offering both cloud and self-hosted options. The self-hosted version is available as a free download from GitHub, allowing users to deploy on their own infrastructure. Uptrace Cloud provides a fully managed experience with enterprise-grade support and compliance options. The platform is designed to scale from small applications to enterprise-level deployments, handling high-volume data ingestion efficiently.

Unified IT observability for hybrid and cloud environments
Checkmk is a unified IT observability platform designed to monitor hybrid and cloud-native environments. It provides full-stack visibility across servers, networks, containers, applications, and more, bridging the gap between legacy systems and modern infrastructure. Trusted by industry leaders, Checkmk delivers scalable, secure, and high-performance monitoring solutions. - Unified Monitoring: Full-stack observability for hybrid and cloud-native IT environments - Multi-Platform Support: Monitor servers, networks, databases, cloud services, Kubernetes, storage, IoT, and SNMP devices - Scalable Architecture: Designed for high performance and enterprise-grade scalability - Multiple Editions: Available as SaaS (Checkmk Cloud), self-hosted (Ultimate, Pro, Community), and virtual/physical appliances - Extensive Integrations: 2,000+ integrations with third-party systems and applications - Automated Discovery: Intelligent service and host discovery with minimal configuration - Alerting & Notifications: Advanced alert management with escalation policies and integrations - Reporting & Dashboards: Customizable dashboards and comprehensive reporting capabilities - Enterprise Support: Professional services, training, and 24/7 support options Checkmk offers multiple deployment options: - SaaS: Checkmk Cloud for fully managed monitoring - Self-Hosted: Checkmk Ultimate, Pro, and Community editions - Appliances: Virtual or physical appliance options for simplified deployment - Open Source: Checkmk Community edition available under GPL license The platform supports Linux-based environments and provides comprehensive documentation for self-hosting configurations. Enterprise features include advanced security, compliance tools, and dedicated support. Explore Editions | Download | Documentation

Unified data reliability platform for AI era
Elementary Data is the control plane for data and AI reliability, unifying observability, quality, governance, and discovery. It enables teams to deliver trusted data at scale in the AI era. - AI Agents: Automate test creation, incident triage, governance, discovery, and performance optimization - Detection & Coverage: Comprehensive data tests and ML-powered monitors for better coverage - Governance: Unified interface for analysts and engineers to explore data and manage metadata - Triage and Response: Understand, prioritize, and resolve issues faster - Business User Tools: Enable analysts and business users to explore data, add validations, and monitor health - Integrations: Works with your existing data stack - Context Engine: Shared context on every dataset and event across your stack Elementary offers both a cloud version and an open-source self-hosted option. The open-source version is available on GitHub.

Open-source observability for traces, logs & metrics
Maple is an open-source observability platform designed for modern applications. Built on OpenTelemetry and powered by ClickHouse, it enables teams to collect, visualize, and analyze distributed traces, logs, and metrics with sub-second query performance. - Unified Observability: Collect and correlate traces, logs, and metrics from all services in one platform - AI-Powered Diagnostics: Leverage AI agents to automatically analyze incidents and propose fixes - Real-Time Incident Response: Follow requests end-to-end with complete context and correlated data - Service Catalog & Maps: Visualize live request flows and service dependencies - Error Tracking: Group errors by type with trends, affected services, and sample traces - Metrics & Dashboards: Customizable dashboards for request rate, error rate, and latency percentiles - Alerting with Context: Receive alerts with attached traces, logs, and relevant context - MCP Server Integration: First-class MCP support for AI agents to interact with your observability data Maple is open-source and can be self-hosted. The platform is built on OpenTelemetry standards and uses ClickHouse for high-performance data storage and querying. Local deployment is available as a single binary for easy setup and management.

Self-hosted error tracking for developers
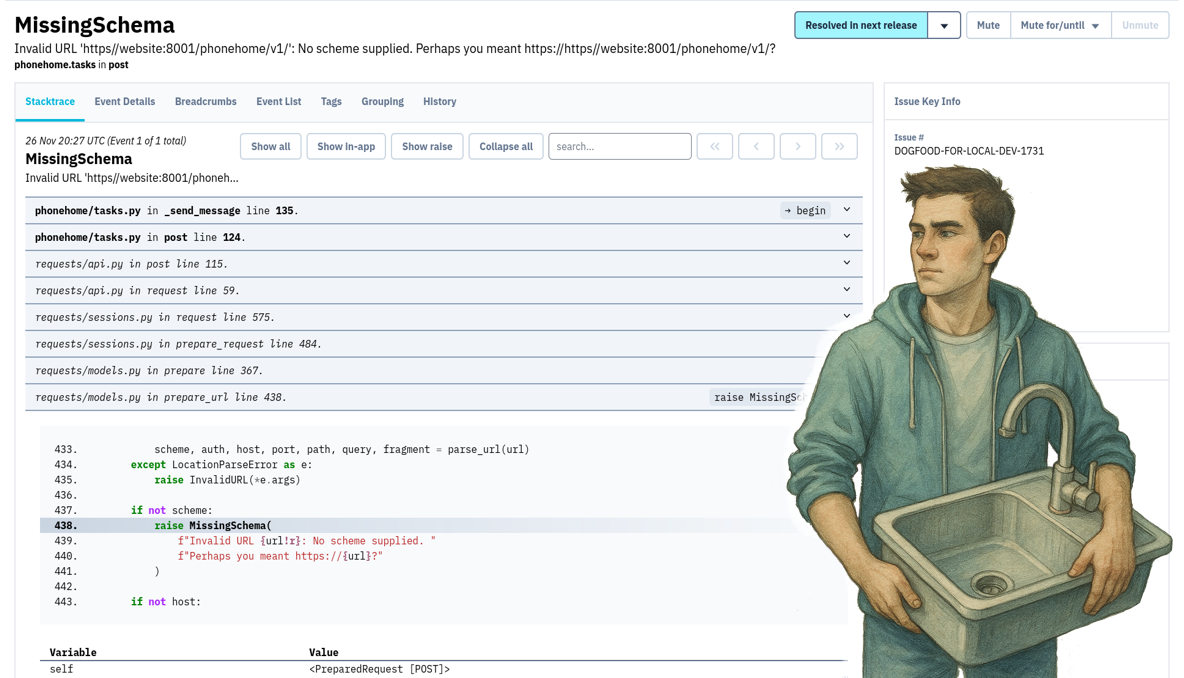
Bugsink provides developers with clear insights into production failures by capturing full stacktraces, local variables, and error context. Designed for self-hosting or managed hosting, it offers Sentry SDK compatibility and predictable pricing at scale. - Full Stacktraces & Local Variables: See exactly why your code failed with complete error context. - Sentry SDK Compatibility: Drop-in replacement for Sentry SDKs across Python, JavaScript, Ruby, PHP, Java, Go, Rust, and more. - Self-Hosting & Managed Hosting: Run on your own servers or use Bugsink’s EU-hosted service with GDPR compliance. - Predictable Costs: No per-event billing; scale to millions of events affordably. - Automatic Issue Grouping: Reduces noise by grouping related errors into manageable issues. - Alerting: Get notified when errors occur via email, Slack, or other integrations. - ARM Compatibility: Works seamlessly on ARM-based servers. - Quick Setup: Deploy in minutes with Docker or Kubernetes. Bugsink is open-source and can be self-hosted on your own infrastructure. It supports Docker and Kubernetes deployments, with detailed installation guides available. The platform is built for scalability and works with existing Sentry SDKs, making migration seamless. For managed hosting, Bugsink offers a GDPR-compliant EU-based service with instant setup and predictable pricing.

Open-source infrastructure monitoring solution
Icinga is a robust open-source monitoring solution designed for comprehensive infrastructure oversight. It provides real-time monitoring of servers, networks, and applications with a flexible configuration language and REST API for seamless integration. - Real-time monitoring of servers, networks, and applications - Powerful configuration language for custom monitoring setups - REST API for easy integration and automation - Scalable architecture suitable for small to large environments - Extensive plugin ecosystem for extended functionality - Distributed monitoring capabilities - Web-based dashboard for visualization and management - Alerting and notification system with customizable thresholds Icinga is open-source software that can be self-hosted on Linux systems. It supports various deployment options including bare-metal installations, virtual machines, and containerized setups. The project provides comprehensive documentation for installation and configuration. Icinga Documentation

Security and uptime monitoring for developers

StatusScout is a comprehensive security and uptime monitoring tool designed for developers and agencies. It provides real-time alerts for downtime, SSL issues, missing security headers, and exposed secrets, ensuring your applications remain secure and operational. - Uptime Monitoring: 24/7 monitoring with instant alerts when your site stops responding. - SSL Certificate Tracking: Alerts before certificates expire to prevent visitor warnings. - Security Header Scanning: Automatically detects missing critical browser security headers. - Subdomain Takeover Protection: Monitors SPF, DKIM, DMARC records and vulnerable subdomains. - Exposed Secrets Detection: Scans for accidentally public environment files, API keys, and sensitive credentials. - User Flow Monitoring: Scheduled tests for key user flows like signup and checkout with failure alerts. - Multi-Channel Alerts: Supports email, SMS, and ntfy notifications. - Self-Hosting Option: Deploy to your own server with full feature access and data ownership. StatusScout is open-source and can be self-hosted on your own infrastructure. The self-hosted version includes all features with no restrictions, though you manage updates, backups, and infrastructure. Cloud-hosted plans are also available for managed services. Made and hosted in the EU with renewable energy-powered infrastructure.

Error tracking and performance monitoring for developers
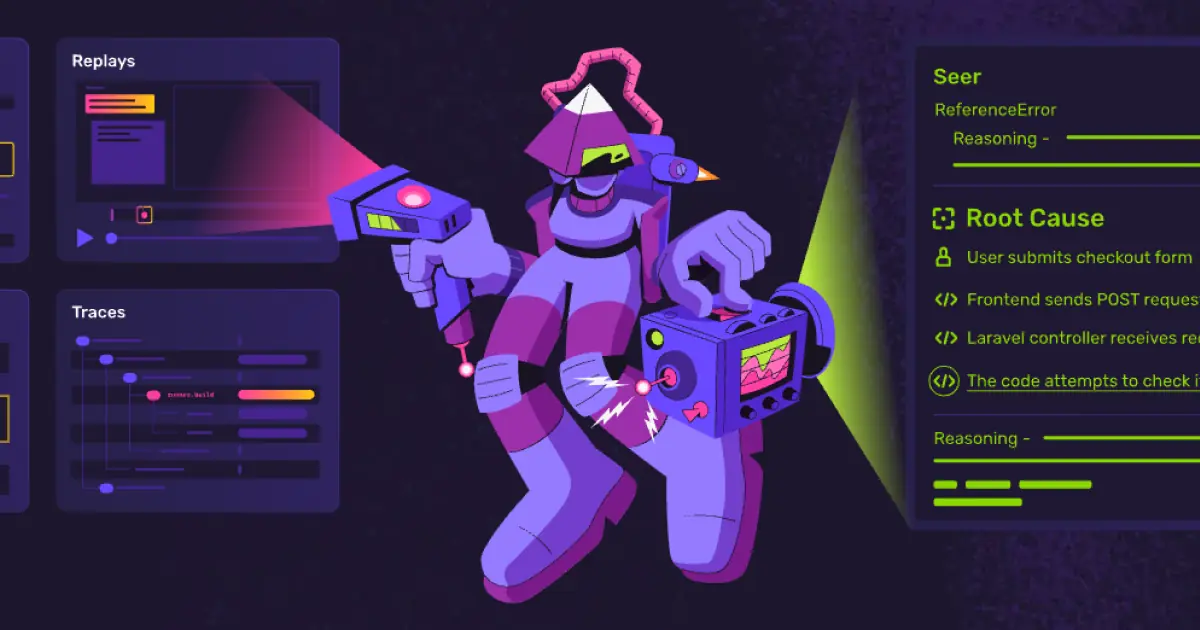
Sentry is a comprehensive error tracking and application performance monitoring (APM) platform designed for developers and software teams. It provides real-time visibility into errors, crashes, and performance bottlenecks across web, mobile, and backend applications. - Error Monitoring: Real-time error tracking with detailed stack traces and context - Performance Monitoring: Application performance insights with tracing and profiling - Session Replay: Visualize user sessions to reproduce and debug issues - AI-Powered Debugging: Seer AI agent for automated issue resolution and code review - Metrics & Monitoring: Custom metrics and uptime monitoring for proactive issue detection - Multi-Platform Support: SDKs for web, mobile, game, and AI applications - Integrations: Native integrations with GitHub, Slack, and other development tools - OpenTelemetry Support: Compatibility with OpenTelemetry standards Sentry offers both cloud-hosted and self-hosted options. The self-hosted version can be deployed on-premises or in private cloud environments, with support for Docker and Kubernetes. The open-source core provides full functionality, while enterprise features are available in paid plans.

Open source observability platform for AI era
OpenObserve is a high-performance, unified observability platform designed for the AI era. It delivers 140x lower storage costs while maintaining enterprise-grade reliability and scalability. - Unified Observability: Monitor logs, metrics, traces, and AI workloads in a single platform - Petabyte-Scale Scalability: Handle massive data volumes efficiently - 90% Cost Savings: Significantly reduce infrastructure and storage expenses - AI-Powered Features: Includes AI SRE and AI assistant capabilities - Kubernetes Monitoring: Native support for containerized environments - LLM Observability: Specialized monitoring for large language models - Visualization & Dashboards: Advanced data visualization tools - Incident Management: Built-in incident tracking and alerting - Open Source Core: Fully open source with AGPL-3.0 license - Self-Hosting: Deployable via Docker or Kubernetes OpenObserve can be self-hosted with a single command: bash docker run \ -p 5080:5080 \ -e ZOROOTUSEREMAIL="[email protected]" \ -e ZOROOTUSERPASSWORD="Complexpass#123" \ o2cr.ai/openobserve/openobserve:latest The platform supports both cloud and on-premises deployments, with enterprise-grade security and compliance features. It's trusted by over 9,000 companies including Fortune 500 giants and innovative startups.

Open-source observability & incident management

OneUptime is a comprehensive open-source platform designed to streamline reliability operations for modern infrastructure. Whether you're a DevOps engineer, Site Reliability Engineer (SRE), or platform team, OneUptime provides the tools needed to monitor systems, detect incidents, and resolve issues efficiently. - Unified Observability: Consolidate logs, metrics, traces, and exceptions in a single interface for comprehensive system visibility. - Incident Management: Detect outages in seconds, page the right engineer, and coordinate incident resolution with smart routing and escalations. - Status Page: Communicate incidents and maintenance windows to users with a customizable public status page. - AI-Powered Incident Investigation: Leverage AI to investigate incidents and generate fix pull requests for faster resolution. - Topology Mapping: Visualize service, infrastructure, and network dependencies to understand system relationships. - On-Call & Alerts: Configure smart alerting with escalation policies to ensure the right team members are notified promptly. - Scheduled Maintenance: Plan and communicate downtime proactively to minimize user impact. - Security Events: Monitor and respond to security incidents with SIEM signals and Sigma detections. - Multi-Environment Support: Monitor Kubernetes, Docker, cloud services, IoT devices, network devices, and more. - Self-Hosting & Enterprise: Deploy on your own infrastructure or opt for enterprise-grade solutions with dedicated support. OneUptime is 100% open-source and can be self-hosted on your own infrastructure. It supports deployment via Docker, Kubernetes, and other container orchestration platforms. The platform is designed for scalability and reliability, making it suitable for both small teams and large enterprises. Comprehensive documentation and community support are available to assist with deployment and configuration.
About New Relic
All-in-one observability platform for engineers to monitor, debug, and improve their entire stack.