7 Best Open Source Databox Alternatives
A curated collection of the 7 best open source and self-hosted alternatives to Databox in 2026.
Looking for a free, privacy-friendly, or self-hosted replacement for Databox in 2026? The top open-source alternative is Apache Superset — Open-source data visualization and exploration platform.
Other highly rated open-source Databox alternatives include Grafana, Metabase and Redash.

Open-source data visualization and exploration platform
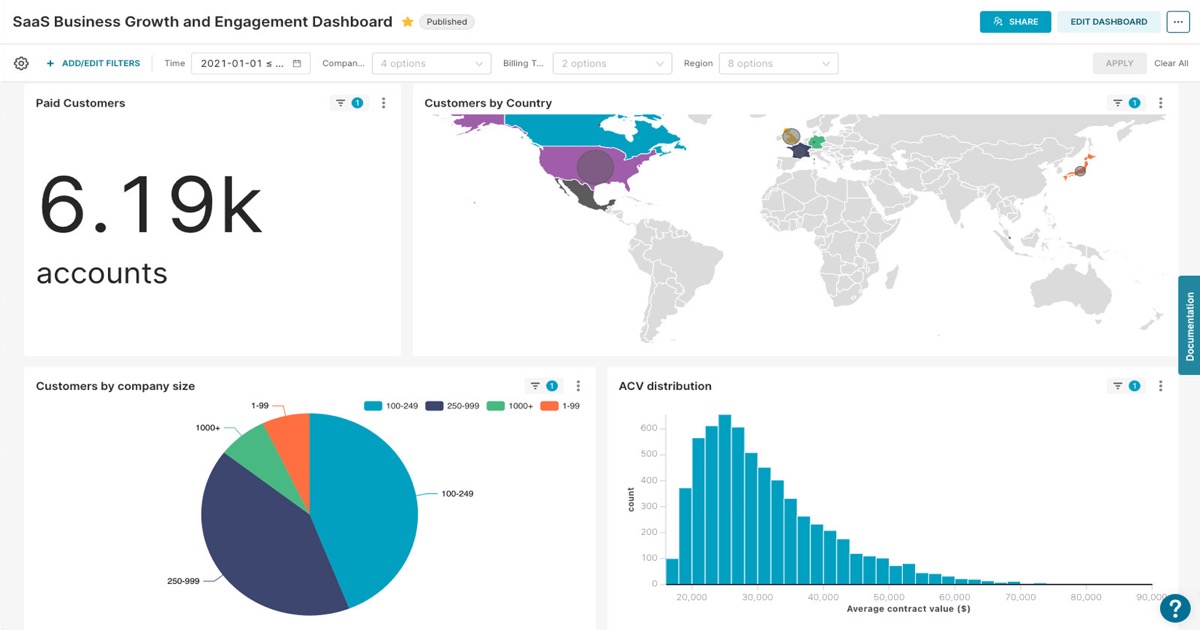
Apache Superset™ is an open-source modern data exploration and visualization platform designed for the cloud-native era. It enables users to create interactive dashboards and charts from any SQL database with a powerful no-code interface or advanced SQL IDE. - 40+ pre-installed visualization types including charts, graphs, and geospatial visualizations - No-code visualization builder for quick chart creation without SQL knowledge - SQL Lab for advanced users to write custom queries, use Jinja templating, and explore database metadata - Scalable architecture that integrates with modern cloud-native databases and engines at petabyte scale - Plug-in architecture for building custom visualizations and extending functionality - Self-serve analytics allowing business users to explore data independently - Dataset management supporting both physical and virtual datasets with unified metric definitions - Security features including role-based access control and database connection management Superset is built on modern web technologies and can be deployed on any infrastructure. It supports containerized deployments (Docker, Kubernetes) and integrates with existing data stacks without requiring additional ingestion layers. The project is Apache 2.0 licensed and welcomes community contributions.
Grafana unifies metrics, logs, traces, profiles, and business data into one OpenTelemetry-native platform with AI-assisted root cause analysis and adaptive cost controls.
Grafana unifies metrics, logs, traces, profiles, and business data into one OpenTelemetry-native platform with AI-assisted root cause analysis and adaptive cost controls.

Open source AI analytics with verified queries

Metabase is an open-source business intelligence and embedded analytics platform designed for teams to explore, visualize, and share data without requiring SQL knowledge. Grounded in your semantic layer—your metrics and business logic—Metabase ensures every answer is verifiable and traceable to its source query. - Self-service analytics: Drag-and-drop query builder for non-technical users - Embedded analytics: SDK for integrating analytics into customer-facing applications - Metabase AI: AI-powered insights and natural language querying - Semantic layer: Centralized metrics and business logic for consistency - Dashboards & reporting: Customizable, shareable dashboards with drill-through capabilities - Data segregation: Role-based access control and permissions - SQL editor: Advanced users can write and execute custom SQL queries - White-label analytics: Fully customizable branding for embedded solutions - CSV uploads: Direct data import for quick analysis - Usage analytics: Track engagement and adoption across teams Metabase is open-source and can be self-hosted on your own infrastructure. It supports a wide range of databases including PostgreSQL, MySQL, BigQuery, Snowflake, and more. The platform is available as a Docker container, on Kubernetes, or as a standalone JAR file. Metabase Cloud offers a managed hosting option with enterprise-grade security and scalability.

Open source data visualization and dashboarding tool

Redash is a powerful open-source platform for connecting to databases and APIs, writing SQL queries, and creating interactive dashboards. It helps teams transform raw data into actionable insights through collaborative visualization and sharing. - Multi-source data connections: Supports PostgreSQL, MySQL, Redshift, BigQuery, MongoDB, and more - Collaborative SQL editor: Browse schemas, create reusable snippets, and write queries with team collaboration - Drag-and-drop dashboards: Visualize data with customizable charts and graphs - Scheduled refreshes: Automatically update dashboards with fresh data - Alerts system: Get notified when data meets specific conditions - User management: Control access and permissions for teams - API access: Integrate with other tools and systems - Open source: Self-hostable with no vendor lock-in Redash is fully open-source and can be self-hosted on your own infrastructure. The project provides comprehensive setup guides for Docker, Kubernetes, and bare-metal installations. It's built with Python, JavaScript, and PostgreSQL, making it suitable for most modern environments.

Open-source, code-first BI platform for modern data teams
Lightdash is the open-source, code-first BI platform designed for modern data teams. It enables you to connect directly to dbt, define metrics once, and instantly generate reliable insights that AI agents can trust. - AI-Native Analytics: Give AI agents access to governed metrics via Slack, Claude, or Lightdash for automated insights. - Code-First Semantic Layer: Define metrics in code (YAML) for consistency and reusability across teams. - Legacy BI Migration: Seamlessly migrate from Looker, Power BI, or Tableau without rebuilding dashboards. - Self-Hosted & Cloud Options: Deploy on your infrastructure or use Lightdash Cloud for managed hosting. - Governed Data Access: Control permissions and data access while empowering teams to build custom data apps. - Trustworthy Metrics: Ensure data accuracy with version-controlled metrics and transparent definitions. - Scalable Pricing: Start for free and scale as your team grows. Lightdash is open-source and can be self-hosted on your own infrastructure. It supports Docker deployments and integrates with existing data stacks like dbt, Snowflake, BigQuery, and PostgreSQL. The platform is built with TypeScript, React, and Node.js, making it extensible for custom integrations.

Build live KPI dashboards from databases & APIs
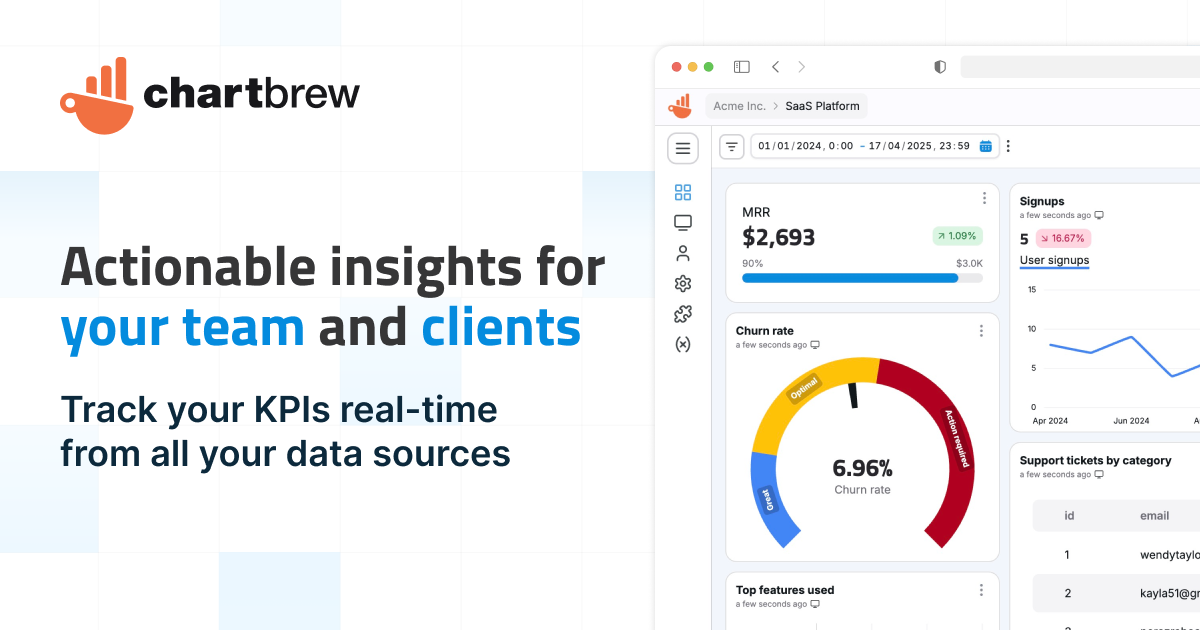
Chartbrew is a self-hostable platform for building live KPI dashboards from your existing data sources. Whether you're tracking internal metrics or sharing client-facing reports, Chartbrew streamlines the process with reusable datasets, AI-assisted setup, and automated sharing. - Multi-source data connection: Pull data from databases (Postgres, MySQL, MongoDB), APIs (Stripe, Google Analytics, Plausible), and analytics tools into a single platform. - Reusable datasets: Create and reuse datasets across charts and dashboards, with support for joining data from multiple sources. - Live KPI dashboards: Build customizable dashboards with charts, tables, goals, and filters to track business health at a glance. - AI-assisted setup: Get help writing SQL queries, building datasets, and exploring data without starting from scratch. - Automated reporting: Schedule chart refreshes, send snapshots via email or Slack, and trigger alerts through webhooks. - Secure sharing: Share dashboards internally, embed them in products, or provide controlled client access with granular permissions. - Self-hosting option: Deploy Chartbrew on your own infrastructure for full data control and customization. - Enterprise-ready: Used by product teams, SaaS companies, and agencies for both internal and client-facing reporting. Chartbrew is built with Node.js and React, offering both cloud-hosted and self-hosted options. The self-hosted version provides full control over data and infrastructure, making it ideal for privacy-conscious teams. The platform supports PostgreSQL, MySQL, and MongoDB for dataset storage and offers integrations with popular data sources like Stripe, Google Analytics, and Supabase. View documentation for deployment guides and API references.

Open source business intelligence tool
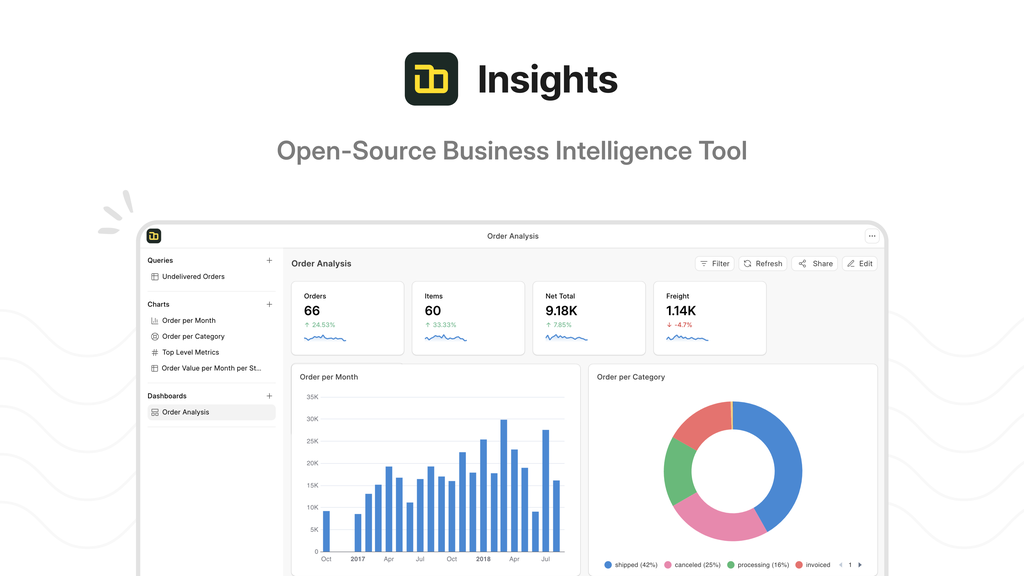
Frappe Insights is an open-source business intelligence (BI) tool designed to help organizations make data-driven decisions efficiently. It simplifies data integration, analysis, and visualization, enabling users to connect disparate data sources, build complex queries without heavy coding, and create reusable reports. - Multi-source Data Integration: Connect and merge data from spreadsheets, databases, and other sources into a single system for unified analysis. - Intuitive Query Builder: Filter, select, and summarize data using built-in functions or custom formulas. Combine datasets with joins and use pivot tables for better summarization. - Automated Reporting: Build reusable reports that update automatically, saving time and effort. - Powerful Visualizations: Generate insightful charts and graphs to comprehend data trends and patterns effectively. - Cost-Effective: Offers a budget-friendly alternative to traditional BI tools while maintaining robust functionality. Frappe Insights is open-source and can be self-hosted. It is built on the Frappe Framework, which supports deployment on various cloud platforms or on-premise infrastructure. The project is actively maintained by Frappe Technologies and is licensed under AGPL-3.0.
About Databox
Visualize and track your business data in real-time with customizable dashboards for informed decision-making.