9 Best Open Source Zabbix Alternatives
A curated collection of the 9 best open source and self-hosted alternatives to Zabbix in 2026.
Looking for a free, privacy-friendly, or self-hosted replacement for Zabbix in 2026? The top open-source alternative is NetData — Real-time infrastructure monitoring with AI troubleshooting.
Other highly rated open-source Zabbix alternatives include Checkmate, Scanopy and Checkmk.

Real-time infrastructure monitoring with AI troubleshooting
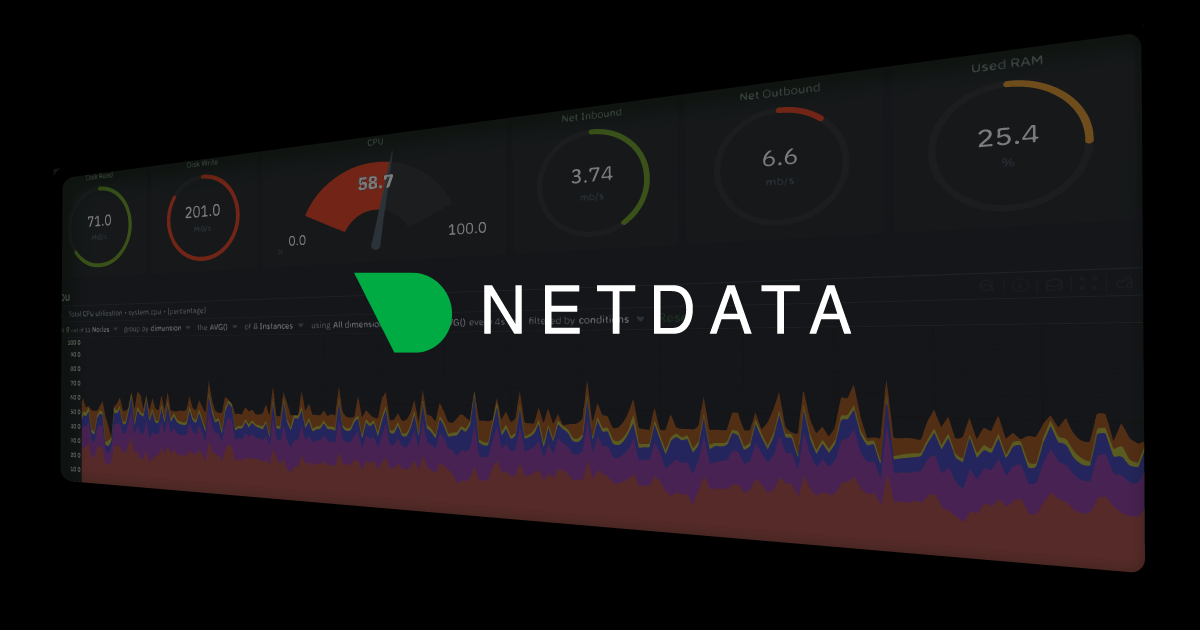
Netdata is a real-time infrastructure monitoring solution designed to transform how teams observe, troubleshoot, and optimize their systems. With per-second metrics collection, unsupervised machine learning for anomaly detection, and AI-driven troubleshooting capabilities, Netdata provides actionable insights to reduce downtime and improve system performance. - Per-second metrics collection for granular system visibility - Unsupervised ML anomaly detection with automatic alerting - AI Co-Engineer for intelligent troubleshooting and root cause analysis - Anomaly Advisor to identify and explain performance issues - Blast Radius Detection to pinpoint affected system components - Zero-configuration deployment with algorithmic dashboards - Distributed observability pipeline for scalable monitoring - Edge computing support for distributed environments - Tiered retention with infinite scalability - eBPF monitoring for deep system-level insights - OpenTelemetry integration for standardized observability - Real-time network monitoring with topology visualization - Custom dashboards without requiring query languages - Mobile apps for monitoring on-the-go - Enterprise access control and zero-code instrumentation Netdata is open-source and can be self-hosted on Linux systems. The platform supports both cloud-based and on-premises deployments, with options for Netdata Agents, Netdata Parents, and Netdata Cloud. The software is designed for extreme cardinality handling and real-time performance at scale, making it suitable for large-scale infrastructure monitoring.

Open-source infrastructure monitoring tool
Checkmate is an open-source, self-hosted infrastructure monitoring tool designed for teams who value control over their data and costs. Monitor servers, websites, Docker containers, and game servers with real-time uptime tracking, performance metrics, and multi-channel alerts. - Uptime Monitoring: Track HTTP, ping, TCP, gRPC, DNS, SSL, WebSocket, and PageSpeed endpoints from 6 continents with GlobalPing. - Infrastructure Monitoring: Monitor CPU, memory, disk, and network usage across all servers with live gauges and historical charts. - Docker Monitoring: Track container health, resource usage, and restart events for services like nginx, postgres, and redis. - Game Server Monitoring: Monitor Minecraft, CS2, Valheim, and other game servers with player counts. - Multi-Channel Alerts: Receive notifications via email, Slack, Discord, Telegram, Twilio SMS, Pushover, Matrix, ntfy, or custom webhooks. - Public Status Pages: Create customizable status pages to keep users informed during incidents. - Response Time Tracking: Monitor and analyze response times with historical charts and performance insights. - Team Collaboration: Invite team members with role-based access control (Admin, Editor, Viewer). - Global Uptime Monitoring: Deploy Checkmate via Docker Compose, Helm, or bare metal for flexible scaling. - Deployment Options: Docker Compose (5-minute setup), Helm charts, or bare metal. - License: AGPL-3.0 (fully open-source with no vendor lock-in). - Data Privacy: All metrics and data remain within your infrastructure—nothing leaves your perimeter. - Scalability: Designed for teams of all sizes, from small setups to enterprise environments. - Integrations: Plugs into existing tools like Slack, Discord, Telegram, and webhooks for seamless workflows.

Self-updating network diagrams for infrastructure
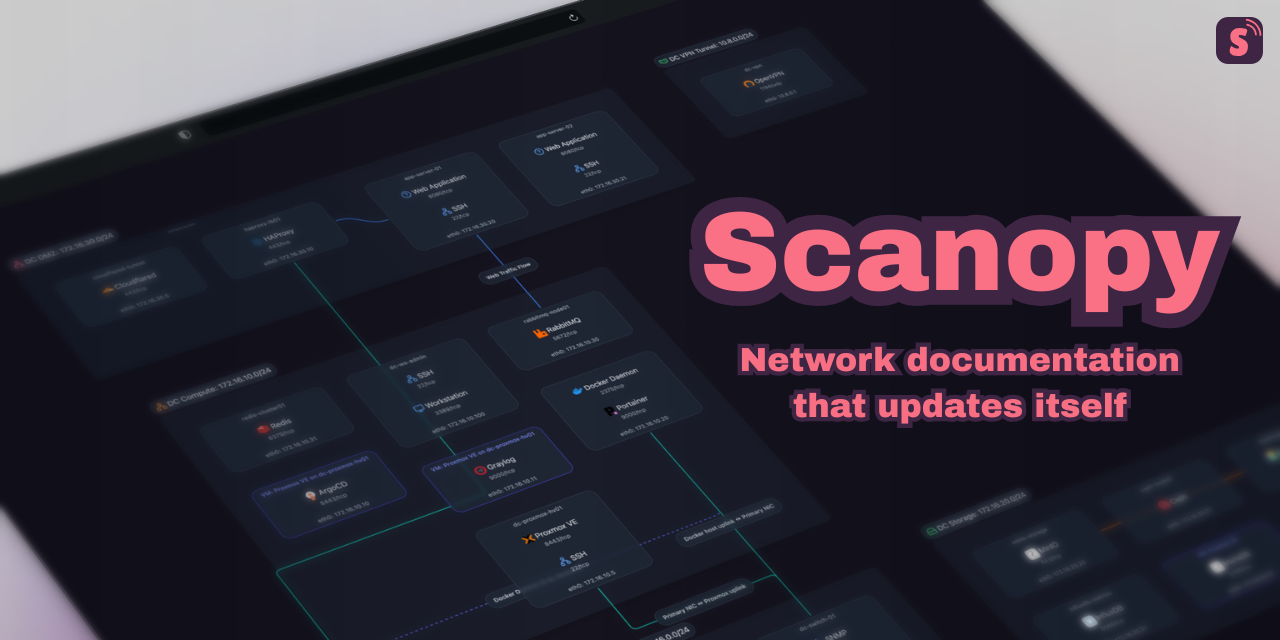
Scanopy is a powerful tool for creating and maintaining network diagrams that update themselves in real-time. It helps DevOps teams and system administrators visualize complex infrastructure with minimal effort. - Automatic Updates: Network diagrams refresh automatically as your infrastructure changes - Real-time Visualization: See your entire system architecture at a glance - Self-Hosted: Full control over your data and infrastructure - Open Source: Free to use and modify with community support - Cross-Platform: Works with various network protocols and systems - Customizable Views: Create different diagram views for different purposes - Integration Ready: Compatible with existing monitoring and logging tools Scanopy is a self-hosted solution that can be deployed on your own infrastructure. The project is open source and available on GitHub. It requires a server environment with Node.js and can be containerized for easy deployment. Documentation for self-hosting is available in the project's repository.

Unified IT observability for hybrid and cloud environments
Checkmk is a unified IT observability platform designed to monitor hybrid and cloud-native environments. It provides full-stack visibility across servers, networks, containers, applications, and more, bridging the gap between legacy systems and modern infrastructure. Trusted by industry leaders, Checkmk delivers scalable, secure, and high-performance monitoring solutions. - Unified Monitoring: Full-stack observability for hybrid and cloud-native IT environments - Multi-Platform Support: Monitor servers, networks, databases, cloud services, Kubernetes, storage, IoT, and SNMP devices - Scalable Architecture: Designed for high performance and enterprise-grade scalability - Multiple Editions: Available as SaaS (Checkmk Cloud), self-hosted (Ultimate, Pro, Community), and virtual/physical appliances - Extensive Integrations: 2,000+ integrations with third-party systems and applications - Automated Discovery: Intelligent service and host discovery with minimal configuration - Alerting & Notifications: Advanced alert management with escalation policies and integrations - Reporting & Dashboards: Customizable dashboards and comprehensive reporting capabilities - Enterprise Support: Professional services, training, and 24/7 support options Checkmk offers multiple deployment options: - SaaS: Checkmk Cloud for fully managed monitoring - Self-Hosted: Checkmk Ultimate, Pro, and Community editions - Appliances: Virtual or physical appliance options for simplified deployment - Open Source: Checkmk Community edition available under GPL license The platform supports Linux-based environments and provides comprehensive documentation for self-hosting configurations. Enterprise features include advanced security, compliance tools, and dedicated support. Explore Editions | Download | Documentation

Open-source infrastructure monitoring solution
Icinga is a robust open-source monitoring solution designed for comprehensive infrastructure oversight. It provides real-time monitoring of servers, networks, and applications with a flexible configuration language and REST API for seamless integration. - Real-time monitoring of servers, networks, and applications - Powerful configuration language for custom monitoring setups - REST API for easy integration and automation - Scalable architecture suitable for small to large environments - Extensive plugin ecosystem for extended functionality - Distributed monitoring capabilities - Web-based dashboard for visualization and management - Alerting and notification system with customizable thresholds Icinga is open-source software that can be self-hosted on Linux systems. It supports various deployment options including bare-metal installations, virtual machines, and containerized setups. The project provides comprehensive documentation for installation and configuration. Icinga Documentation

Free open source network & server monitoring tool
Nagios Core is a robust open-source monitoring engine designed for IT infrastructure management. It provides comprehensive monitoring capabilities for servers, networks, applications, and services, ensuring system reliability and uptime. - Server & Network Monitoring: Tracks the status of servers, switches, routers, and other network devices. - Plugin Support: Extensive library of plugins for monitoring diverse applications and services. - Alerting System: Configurable notifications via email, SMS, or other methods for critical issues. - Web Interface: User-friendly web dashboard for monitoring and configuration. - Scalability: Supports distributed monitoring with add-ons like Mod-Gearman. - Extensibility: Modular architecture allows integration with third-party tools and systems. - Historical Data: Maintains performance metrics and logs for trend analysis. - Community & Enterprise Support: Active community with commercial support options available. - License: GPLv2 - Self-Hosted: Yes - Deployment: Requires Linux server with Apache/Nginx and MySQL/PostgreSQL. - Add-ons: NCPA (Nagios Cross-Platform Agent) for multi-platform monitoring. - Scalability: Can be extended with plugins and distributed setups.

Open-source monitoring & time series database

Prometheus is an open-source monitoring system and time series database designed for cloud-native environments. It provides a flexible dimensional data model, a powerful PromQL query language, and efficient alerting mechanisms. - Dimensional data model: Identifies time series by metric names and key-value pairs for flexible data organization. - PromQL query language: Enables powerful querying, correlation, and transformation of time series data for visualizations and alerts. - Precise alerting: Uses Alertmanager to handle notifications and silencing based on PromQL rules. - Simple operation: Operates independently with local storage, deployable as statically linked binaries across environments. - Instrumentation libraries: Offers official and community-contributed libraries for metrics instrumentation in major languages. - Ubiquitous integrations: Includes hundreds of official and community integrations for extracting metrics from existing systems. - Cloud-native integration: Works seamlessly with Kubernetes and other cloud/container managers for continuous service discovery and monitoring. - Open governance: A CNCF graduated project with 100% open-source components under the Apache 2 License. Prometheus is 100% open-source and self-hostable, with all components available under the Apache 2 License. It is developed in Go and designed for easy deployment across various environments, including Kubernetes and cloud infrastructures. The system operates independently with local storage, ensuring minimal external dependencies.
Grafana unifies metrics, logs, traces, profiles, and business data into one OpenTelemetry-native platform with AI-assisted root cause analysis and adaptive cost controls.
Grafana unifies metrics, logs, traces, profiles, and business data into one OpenTelemetry-native platform with AI-assisted root cause analysis and adaptive cost controls.

Self-hosted uptime monitoring for websites and APIs
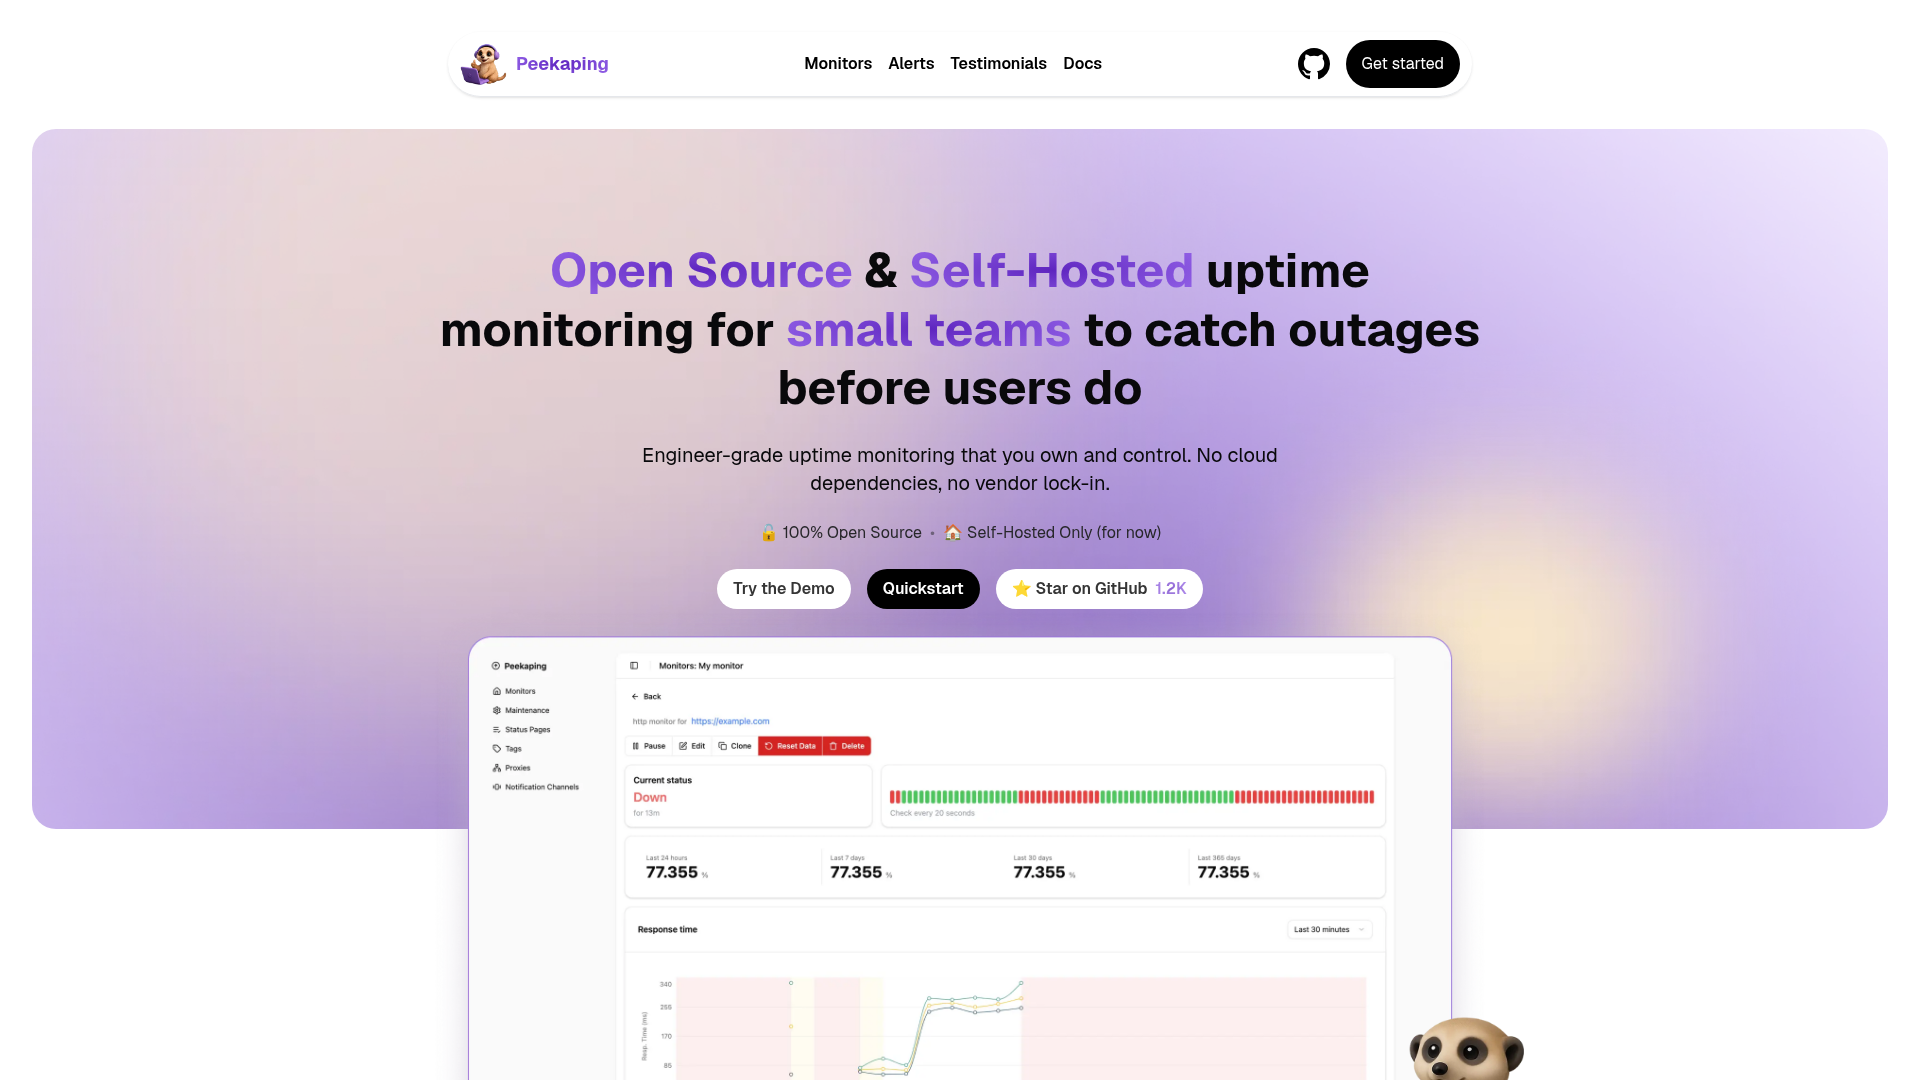
Peekaping is an open-source, self-hosted uptime monitoring solution designed for small teams and businesses that need to catch outages before users do. Built with Go and React, it provides engineer-grade monitoring with complete data ownership and no cloud dependencies. Monitor Types - Web & Network: HTTP/HTTPS, TCP, Ping (ICMP), DNS - Application & Infrastructure: Push webhooks, Docker containers, gRPC, SNMP - Databases & Caches: PostgreSQL, Microsoft SQL Server, MongoDB, Redis - Messaging & Streaming: MQTT Broker, RabbitMQ, Kafka Producer Alert Channels - Email & Webhooks: SMTP, custom webhooks - Chat & Collaboration: Telegram, Slack, Google Chat, Signal, Mattermost, Matrix, Discord, WeCom, WhatsApp - On-Call & Incident: PagerDuty, Opsgenie, Grafana OnCall - Mobile Push & Self-Hosted: NTFY, Gotify, Pushover Status Pages - Public branded status pages showing uptime and performance metrics - Customizable branding and metrics display API-First Design - REST API with Swagger/OpenAPI documentation - Modular architecture for easy extension - Pluggable storage backends (PostgreSQL, MongoDB, SQLite) Core Technologies - Backend: Go (Golang) for high-performance monitoring - Frontend: React + TypeScript for admin dashboard and status pages - Deployment: Official Docker images with docker-compose support - Storage Options: PostgreSQL, MongoDB, or SQLite for flexible setups Peekaping is MIT-licensed and completely free for both personal and commercial use. It offers a modern alternative to proprietary uptime monitoring services while maintaining full data privacy and control.
About Zabbix
Zabbix is an enterprise-class, open-source monitoring solution that simplifies network and application monitoring through real-time data collection, processing, and visualization.
Key Features of Zabbix
- Multi-platform monitoring: Tracks networks, servers, clouds, containers, VMware, Windows, IoT, logs, databases, and applications
- Real-time alerts: Customizable triggers and notifications for proactive issue resolution
- Scalable architecture: Supports large-scale deployments with distributed monitoring
- Visualization tools: Advanced dashboards and graphs for data analysis
- Extensive integrations: 300+ monitoring templates and API integrations
- Security compliance: Meets NIS2 and other enterprise security standards
- Cloud deployment: Quick setup with Zabbix Cloud (60-second deployment)
- Professional services: Implementation, migration, and consulting options available
Tech / Self-Hosting
Zabbix is fully self-hostable and open-source under the GPL license. It supports Linux, Windows, and containerized deployments. The software is GDPR compliant and offers enterprise-grade security features. Self-hosting documentation is available at https://www.zabbix.com/documentation.