11 Best Open Source LogicMonitor Alternatives
A curated collection of the 11 best open source and self-hosted alternatives to LogicMonitor in 2026.
Looking for a free, privacy-friendly, or self-hosted replacement for LogicMonitor in 2026? The top open-source alternative is Uptime Kuma — Self-hosted website monitoring tool.
Other highly rated open-source LogicMonitor alternatives include NetData, OpenObserve and Keep.

Self-hosted website monitoring tool

Uptime Kuma is a lightweight, self-hosted monitoring tool designed for developers and small teams. It provides real-time monitoring of websites and services, tracking uptime, response times, and status pages with minimal resource usage. - Real-time Monitoring: Tracks uptime and response times of websites and services. - Status Pages: Public or private status pages to communicate service status. - Notifications: Supports multiple notification channels (Discord, Slack, Telegram, etc.). - Multi-language: Available in multiple languages for global accessibility. - Lightweight: Runs efficiently on low-resource systems. - Docker Support: Easy deployment via Docker containers. - Customizable: Configure checks, intervals, and thresholds. - Open Source: Fully open-source with community-driven development. Uptime Kuma is built with Node.js and can be self-hosted on any system with Docker support. It requires minimal setup and is compatible with most cloud and on-premise environments. The project is actively maintained and welcomes contributions from the community.

Real-time infrastructure monitoring with AI troubleshooting
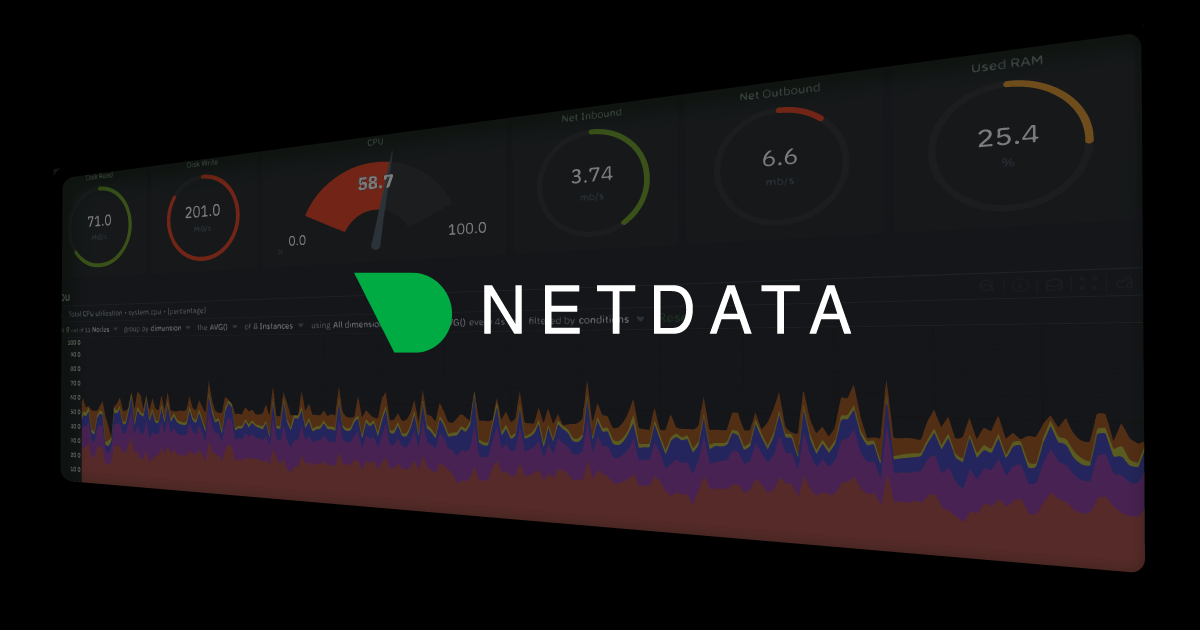
Netdata is a real-time infrastructure monitoring solution designed to transform how teams observe, troubleshoot, and optimize their systems. With per-second metrics collection, unsupervised machine learning for anomaly detection, and AI-driven troubleshooting capabilities, Netdata provides actionable insights to reduce downtime and improve system performance. - Per-second metrics collection for granular system visibility - Unsupervised ML anomaly detection with automatic alerting - AI Co-Engineer for intelligent troubleshooting and root cause analysis - Anomaly Advisor to identify and explain performance issues - Blast Radius Detection to pinpoint affected system components - Zero-configuration deployment with algorithmic dashboards - Distributed observability pipeline for scalable monitoring - Edge computing support for distributed environments - Tiered retention with infinite scalability - eBPF monitoring for deep system-level insights - OpenTelemetry integration for standardized observability - Real-time network monitoring with topology visualization - Custom dashboards without requiring query languages - Mobile apps for monitoring on-the-go - Enterprise access control and zero-code instrumentation Netdata is open-source and can be self-hosted on Linux systems. The platform supports both cloud-based and on-premises deployments, with options for Netdata Agents, Netdata Parents, and Netdata Cloud. The software is designed for extreme cardinality handling and real-time performance at scale, making it suitable for large-scale infrastructure monitoring.

Open source observability platform for AI era
OpenObserve is a high-performance, unified observability platform designed for the AI era. It delivers 140x lower storage costs while maintaining enterprise-grade reliability and scalability. - Unified Observability: Monitor logs, metrics, traces, and AI workloads in a single platform - Petabyte-Scale Scalability: Handle massive data volumes efficiently - 90% Cost Savings: Significantly reduce infrastructure and storage expenses - AI-Powered Features: Includes AI SRE and AI assistant capabilities - Kubernetes Monitoring: Native support for containerized environments - LLM Observability: Specialized monitoring for large language models - Visualization & Dashboards: Advanced data visualization tools - Incident Management: Built-in incident tracking and alerting - Open Source Core: Fully open source with AGPL-3.0 license - Self-Hosting: Deployable via Docker or Kubernetes OpenObserve can be self-hosted with a single command: bash docker run \ -p 5080:5080 \ -e ZOROOTUSEREMAIL="[email protected]" \ -e ZOROOTUSERPASSWORD="Complexpass#123" \ o2cr.ai/openobserve/openobserve:latest The platform supports both cloud and on-premises deployments, with enterprise-grade security and compliance features. It's trusted by over 9,000 companies including Fortune 500 giants and innovative startups.
Open-source platform for centralizing alerts, automating responses, and enhancing incident management across your tech stack.
Open-source platform for centralizing alerts, automating responses, and enhancing incident management across your tech stack.

Automated status pages with advanced uptime monitoring

Gatus is an open-source status page and uptime monitoring tool designed to help teams track the health of their services with precision. Whether you're monitoring simple HTTP endpoints or complex multi-step workflows, Gatus provides the flexibility to set custom health check conditions and receive immediate notifications when issues arise. - Comprehensive Uptime Monitoring: Track HTTP/HTTPS, DNS, TCP, ICMP endpoints with custom conditions. Validate JSON responses, check SSL certificates, and monitor response times for complete service health visibility. - Test Suites for Complex Workflows: Execute sequential endpoint tests with shared context to validate entire business processes, authentication flows, CRUD operations, and end-to-end transactions. - Instant Alerting: Receive downtime notifications via Slack, Discord, PagerDuty, email, and 15+ other platforms. Configure custom thresholds and escalation rules for proactive incident management. - Public Status Pages: Create transparent, user-focused status pages that automatically update based on real-time monitoring data. Display incident reports, maintenance schedules, and resolution timelines with color-coded priority levels. - Push-Based Monitoring: Monitor services in private networks using custom agents that push status updates to Gatus, eliminating the need to expose internal systems to the internet. - Developer-Friendly API: Integrate uptime checks with CI/CD pipelines, webhook monitoring, and comprehensive logging for technical diagnostics and issue resolution. - SSL Certificate Monitoring: Track SSL certificate expiration dates to prevent unexpected outages due to expired certificates. - Custom Health Check Conditions: Go beyond simple ping checks by validating specific response codes, JSON payloads, and custom monitoring logic tailored to your services. Gatus is built on open-source technology and can be self-hosted for complete control over your monitoring infrastructure. The project is actively maintained on GitHub with transparent development and community contributions. The software is lightweight, easy to deploy, and designed for scalability to handle monitoring needs of any size.

eBPF-powered AI observability platform
Coroot is an eBPF-powered and AI-guided observability platform designed to provide full-stack visibility with minimal setup. It automatically collects metrics, logs, traces, and profiles across your entire infrastructure—from applications and databases to cloud and network layers—without requiring any code changes. - AI-Powered Root Cause Analysis: Instantly identifies and explains issues using complete telemetry data, acting like an experienced engineer to trace dependencies and suggest fixes. - Zero-Code Setup: Deploys with no instrumentation or configuration changes, leveraging eBPF for automatic data collection. - Full-Stack Visibility: Monitors applications, databases (PostgreSQL, MongoDB), Kubernetes, cloud services, and network components in a unified view. - Continuous Profiling: Captures performance profiles to identify bottlenecks and optimize resource usage. - Service Mapping: Visualizes service dependencies and interactions to simplify troubleshooting. - OpenTelemetry Integration: Supports OpenTelemetry standards for seamless data ingestion and compatibility. - Alerting & Insights: Converts raw telemetry into actionable alerts and recommendations. - Enterprise Edition: Offers advanced features for large-scale deployments, including enhanced security and scalability. Coroot is open-source and can be self-hosted using Docker or Kubernetes. The platform is designed for ease of deployment, with pre-built images and Helm charts available for quick setup. It supports integration with existing observability stacks and adheres to open standards like OpenTelemetry. For more details, visit the documentation or explore the GitHub repository.

Self-updating network diagrams for infrastructure
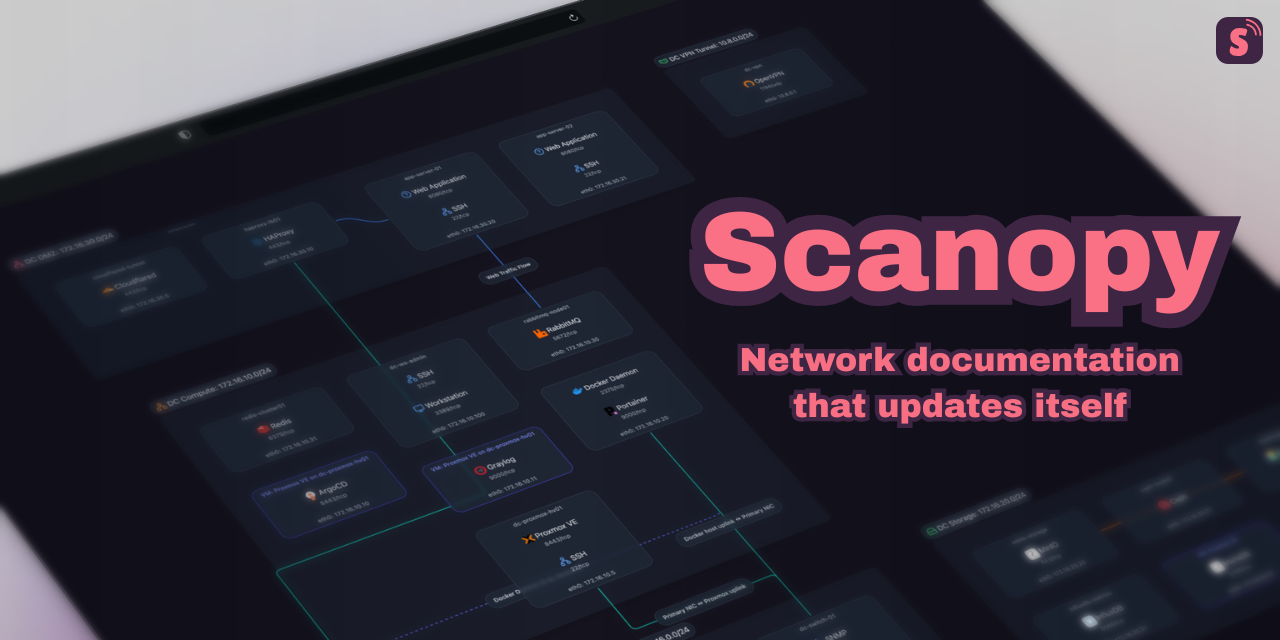
Scanopy is a powerful tool for creating and maintaining network diagrams that update themselves in real-time. It helps DevOps teams and system administrators visualize complex infrastructure with minimal effort. - Automatic Updates: Network diagrams refresh automatically as your infrastructure changes - Real-time Visualization: See your entire system architecture at a glance - Self-Hosted: Full control over your data and infrastructure - Open Source: Free to use and modify with community support - Cross-Platform: Works with various network protocols and systems - Customizable Views: Create different diagram views for different purposes - Integration Ready: Compatible with existing monitoring and logging tools Scanopy is a self-hosted solution that can be deployed on your own infrastructure. The project is open source and available on GitHub. It requires a server environment with Node.js and can be containerized for easy deployment. Documentation for self-hosting is available in the project's repository.

Unified IT observability for hybrid and cloud environments
Checkmk is a unified IT observability platform designed to monitor hybrid and cloud-native environments. It provides full-stack visibility across servers, networks, containers, applications, and more, bridging the gap between legacy systems and modern infrastructure. Trusted by industry leaders, Checkmk delivers scalable, secure, and high-performance monitoring solutions. - Unified Monitoring: Full-stack observability for hybrid and cloud-native IT environments - Multi-Platform Support: Monitor servers, networks, databases, cloud services, Kubernetes, storage, IoT, and SNMP devices - Scalable Architecture: Designed for high performance and enterprise-grade scalability - Multiple Editions: Available as SaaS (Checkmk Cloud), self-hosted (Ultimate, Pro, Community), and virtual/physical appliances - Extensive Integrations: 2,000+ integrations with third-party systems and applications - Automated Discovery: Intelligent service and host discovery with minimal configuration - Alerting & Notifications: Advanced alert management with escalation policies and integrations - Reporting & Dashboards: Customizable dashboards and comprehensive reporting capabilities - Enterprise Support: Professional services, training, and 24/7 support options Checkmk offers multiple deployment options: - SaaS: Checkmk Cloud for fully managed monitoring - Self-Hosted: Checkmk Ultimate, Pro, and Community editions - Appliances: Virtual or physical appliance options for simplified deployment - Open Source: Checkmk Community edition available under GPL license The platform supports Linux-based environments and provides comprehensive documentation for self-hosting configurations. Enterprise features include advanced security, compliance tools, and dedicated support. Explore Editions | Download | Documentation

Open-source infrastructure monitoring solution
Icinga is a robust open-source monitoring solution designed for comprehensive infrastructure oversight. It provides real-time monitoring of servers, networks, and applications with a flexible configuration language and REST API for seamless integration. - Real-time monitoring of servers, networks, and applications - Powerful configuration language for custom monitoring setups - REST API for easy integration and automation - Scalable architecture suitable for small to large environments - Extensive plugin ecosystem for extended functionality - Distributed monitoring capabilities - Web-based dashboard for visualization and management - Alerting and notification system with customizable thresholds Icinga is open-source software that can be self-hosted on Linux systems. It supports various deployment options including bare-metal installations, virtual machines, and containerized setups. The project provides comprehensive documentation for installation and configuration. Icinga Documentation

Free open source network & server monitoring tool
Nagios Core is a robust open-source monitoring engine designed for IT infrastructure management. It provides comprehensive monitoring capabilities for servers, networks, applications, and services, ensuring system reliability and uptime. - Server & Network Monitoring: Tracks the status of servers, switches, routers, and other network devices. - Plugin Support: Extensive library of plugins for monitoring diverse applications and services. - Alerting System: Configurable notifications via email, SMS, or other methods for critical issues. - Web Interface: User-friendly web dashboard for monitoring and configuration. - Scalability: Supports distributed monitoring with add-ons like Mod-Gearman. - Extensibility: Modular architecture allows integration with third-party tools and systems. - Historical Data: Maintains performance metrics and logs for trend analysis. - Community & Enterprise Support: Active community with commercial support options available. - License: GPLv2 - Self-Hosted: Yes - Deployment: Requires Linux server with Apache/Nginx and MySQL/PostgreSQL. - Add-ons: NCPA (Nagios Cross-Platform Agent) for multi-platform monitoring. - Scalability: Can be extended with plugins and distributed setups.

Open-source transactional email platform

Plunk is an open-source, self-hostable email platform designed for transactional emails, marketing campaigns, and automated workflows. Built with privacy in mind, it offers transparent pricing, no contact limits, and full control over your email infrastructure. - Transactional & Marketing Emails: Send both transactional emails and marketing campaigns from a single platform. - Automated Workflows: Trigger workflows based on events sent from your code, with a visual canvas for full transparency. - Inbound Email Handling: Receive emails at your domain by adding an MX record, turning replies into contacts and triggering workflows. - Unlimited Contacts: Store unlimited contacts for free; pay only per email sent ($0.001 per email). - Self-Hosting & Open Source: Fully inspectable, forkable, and self-hostable under AGPL-3.0 license. - MCP Server Integration: Connect AI agents (Claude, Cursor) to manage emails via the Model Context Protocol. - Email Editor & SMTP: Visual editor for emails or direct HTML editing, plus SMTP support for existing clients. - Analytics & Segments: Track delivery, opens, clicks, and bounces per send, with dynamic segments that update in real-time. - License: AGPL-3.0 - Hosting: EU-based cloud or self-hosted via Docker Compose - GitHub Stars: 5,000+ - Setup Time: Under 5 minutes for domain configuration and first send - Exit Strategy: Full control via Docker Compose for seamless migration away from the cloud service.
About LogicMonitor
LogicMonitor is the AI-first platform for Autonomous IT, enabling enterprises to operate complex digital systems with greater resilience, efficiency, and confidence.
Key Features of LogicMonitor
- Agentic AIOps: Autonomously detect, diagnose, and resolve issues across your environment.
- Infrastructure Observability: Comprehensive monitoring for hybrid and multi-cloud environments.
- Cloud Observability: Deep visibility into cloud services and workloads.
- Internet Performance Monitoring: Real-time tracking of global digital experience.
- Digital Experience Monitoring: End-user experience insights and performance metrics.
- Log Management: Centralized log collection, analysis, and retention.
- Edwin AI: AI agent that transforms fragmented event noise into explainable, actionable insights.
- AI Automation: Governed, closed-loop remediation across automation playbooks.
- Event Intelligence: Compresses raw alert storms into high-fidelity, prioritized insights.
Tech / Self-Hosting
LogicMonitor is a fully managed SaaS platform with no self-hosting options. The service is hosted globally with data centers in multiple regions to ensure low-latency performance and compliance with regional data regulations.