8 Best Open Source Opsgenie Alternatives
A curated collection of the 8 best open source and self-hosted alternatives to Opsgenie in 2026.
Looking for a free, privacy-friendly, or self-hosted replacement for Opsgenie in 2026? The top open-source alternative is Uptime Kuma — Self-hosted website monitoring tool.
Other highly rated open-source Opsgenie alternatives include Keep, Gatus and OneUptime.

Self-hosted website monitoring tool
Uptime Kuma is a lightweight, self-hosted monitoring tool designed for developers and small teams. It provides real-time monitoring of websites and services, tracking uptime, response times, and status pages with minimal resource usage. - Real-time Monitoring: Tracks uptime and response times of websites and services. - Status Pages: Public or private status pages to communicate service status. - Notifications: Supports multiple notification channels (Discord, Slack, Telegram, etc.). - Multi-language: Available in multiple languages for global accessibility. - Lightweight: Runs efficiently on low-resource systems. - Docker Support: Easy deployment via Docker containers. - Customizable: Configure checks, intervals, and thresholds. - Open Source: Fully open-source with community-driven development. Uptime Kuma is built with Node.js and can be self-hosted on any system with Docker support. It requires minimal setup and is compatible with most cloud and on-premise environments. The project is actively maintained and welcomes contributions from the community.
Open-source platform for centralizing alerts, automating responses, and enhancing incident management across your tech stack.
Open-source platform for centralizing alerts, automating responses, and enhancing incident management across your tech stack.

Automated status pages with advanced uptime monitoring
Gatus is an open-source status page and uptime monitoring tool designed to help teams track the health of their services with precision. Whether you're monitoring simple HTTP endpoints or complex multi-step workflows, Gatus provides the flexibility to set custom health check conditions and receive immediate notifications when issues arise. - Comprehensive Uptime Monitoring: Track HTTP/HTTPS, DNS, TCP, ICMP endpoints with custom conditions. Validate JSON responses, check SSL certificates, and monitor response times for complete service health visibility. - Test Suites for Complex Workflows: Execute sequential endpoint tests with shared context to validate entire business processes, authentication flows, CRUD operations, and end-to-end transactions. - Instant Alerting: Receive downtime notifications via Slack, Discord, PagerDuty, email, and 15+ other platforms. Configure custom thresholds and escalation rules for proactive incident management. - Public Status Pages: Create transparent, user-focused status pages that automatically update based on real-time monitoring data. Display incident reports, maintenance schedules, and resolution timelines with color-coded priority levels. - Push-Based Monitoring: Monitor services in private networks using custom agents that push status updates to Gatus, eliminating the need to expose internal systems to the internet. - Developer-Friendly API: Integrate uptime checks with CI/CD pipelines, webhook monitoring, and comprehensive logging for technical diagnostics and issue resolution. - SSL Certificate Monitoring: Track SSL certificate expiration dates to prevent unexpected outages due to expired certificates. - Custom Health Check Conditions: Go beyond simple ping checks by validating specific response codes, JSON payloads, and custom monitoring logic tailored to your services. Gatus is built on open-source technology and can be self-hosted for complete control over your monitoring infrastructure. The project is actively maintained on GitHub with transparent development and community contributions. The software is lightweight, easy to deploy, and designed for scalability to handle monitoring needs of any size.

Open-source observability & incident management

OneUptime is a comprehensive open-source platform designed to streamline reliability operations for modern infrastructure. Whether you're a DevOps engineer, Site Reliability Engineer (SRE), or platform team, OneUptime provides the tools needed to monitor systems, detect incidents, and resolve issues efficiently. - Unified Observability: Consolidate logs, metrics, traces, and exceptions in a single interface for comprehensive system visibility. - Incident Management: Detect outages in seconds, page the right engineer, and coordinate incident resolution with smart routing and escalations. - Status Page: Communicate incidents and maintenance windows to users with a customizable public status page. - AI-Powered Incident Investigation: Leverage AI to investigate incidents and generate fix pull requests for faster resolution. - Topology Mapping: Visualize service, infrastructure, and network dependencies to understand system relationships. - On-Call & Alerts: Configure smart alerting with escalation policies to ensure the right team members are notified promptly. - Scheduled Maintenance: Plan and communicate downtime proactively to minimize user impact. - Security Events: Monitor and respond to security incidents with SIEM signals and Sigma detections. - Multi-Environment Support: Monitor Kubernetes, Docker, cloud services, IoT devices, network devices, and more. - Self-Hosting & Enterprise: Deploy on your own infrastructure or opt for enterprise-grade solutions with dedicated support. OneUptime is 100% open-source and can be self-hosted on your own infrastructure. It supports deployment via Docker, Kubernetes, and other container orchestration platforms. The platform is designed for scalability and reliability, making it suitable for both small teams and large enterprises. Comprehensive documentation and community support are available to assist with deployment and configuration.

Free open source network & server monitoring tool
Nagios Core is a robust open-source monitoring engine designed for IT infrastructure management. It provides comprehensive monitoring capabilities for servers, networks, applications, and services, ensuring system reliability and uptime. - Server & Network Monitoring: Tracks the status of servers, switches, routers, and other network devices. - Plugin Support: Extensive library of plugins for monitoring diverse applications and services. - Alerting System: Configurable notifications via email, SMS, or other methods for critical issues. - Web Interface: User-friendly web dashboard for monitoring and configuration. - Scalability: Supports distributed monitoring with add-ons like Mod-Gearman. - Extensibility: Modular architecture allows integration with third-party tools and systems. - Historical Data: Maintains performance metrics and logs for trend analysis. - Community & Enterprise Support: Active community with commercial support options available. - License: GPLv2 - Self-Hosted: Yes - Deployment: Requires Linux server with Apache/Nginx and MySQL/PostgreSQL. - Add-ons: NCPA (Nagios Cross-Platform Agent) for multi-platform monitoring. - Scalability: Can be extended with plugins and distributed setups.

Open-source event tracker for SaaS products
Operational.co is an open-source event tracking tool designed for SaaS products, providing real-time monitoring and notifications for critical events such as user signups, payments, cancellations, webhooks, jobs, and errors. - Real-time notifications: Receive push notifications on mobile or web app for critical events. - Action buttons: Trigger webhooks within your product directly from events. - Event contexts: Chain events together to understand complex workflows. - JSON logging: Easily track and log webhooks with structured data. - Playground: Simplify integration with a code playground for quick setup. - AI-assisted setup: Generate integration snippets using AI agents like ChatGPT or Claude. - Multi-platform support: Works with SaaS, WordPress, eCommerce, and DevOps tools. - Extensive API: Highly expressive API for custom event ingestion and monitoring. Operational.co is open-source and can be self-hosted. The project is available on GitHub with detailed documentation for setup and integration. The platform supports multiple programming languages and frameworks, making it adaptable to various tech stacks.

Self-hosted OpsGenie replacement with AI root cause analysis
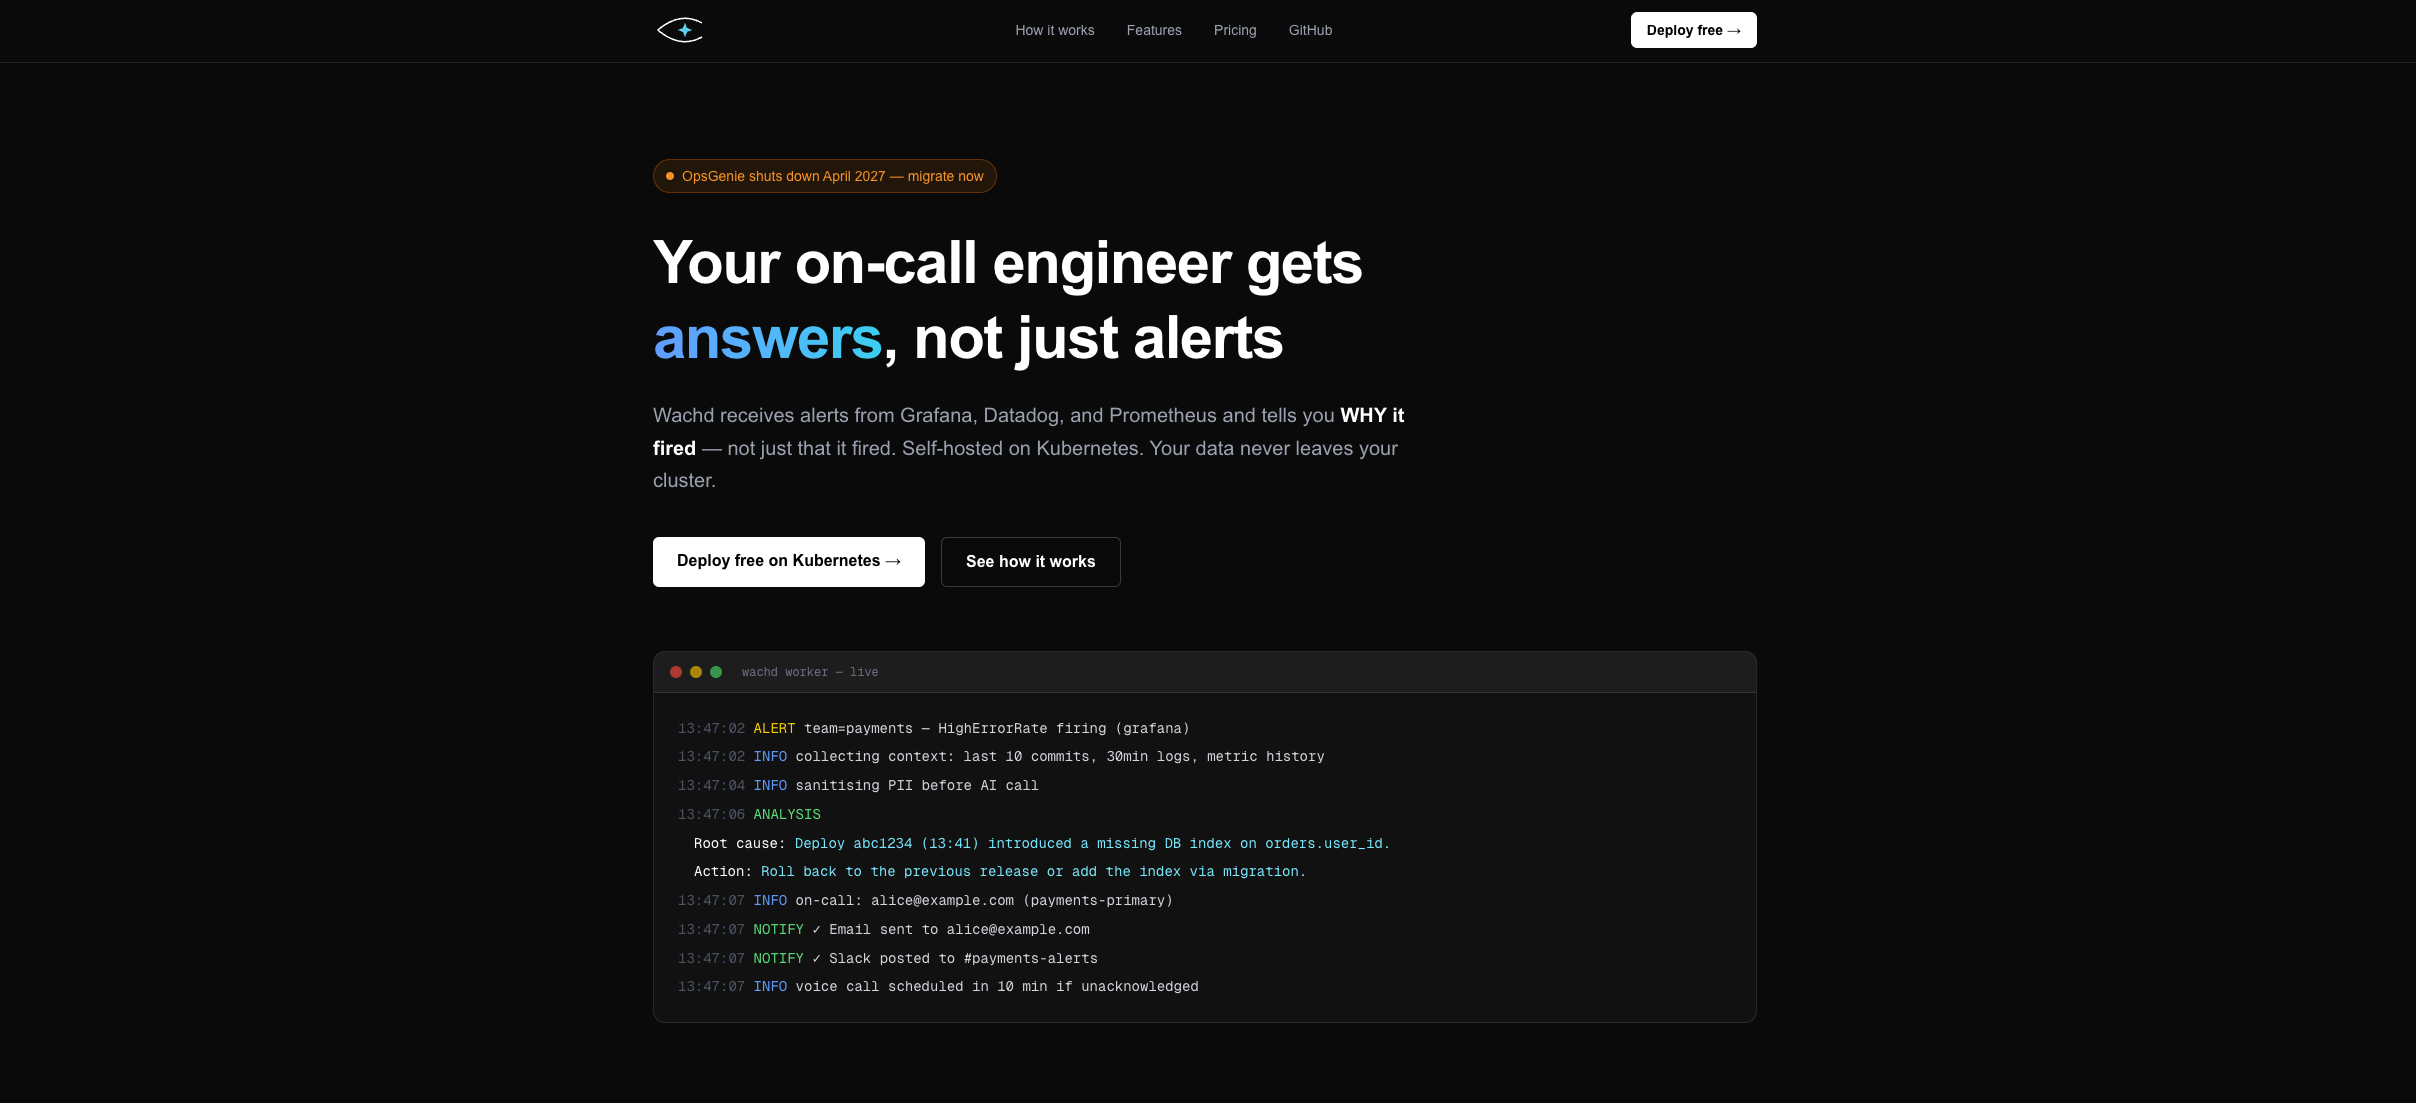
Wachd transforms raw alerts into actionable insights by providing AI-powered root cause analysis for your on-call incidents. Self-hosted on Kubernetes, it integrates with Grafana, Datadog, and Prometheus to deliver clear answers—not just notifications—while keeping all data within your infrastructure. - AI Root Cause Analysis: Automatically correlates commits, logs, and metrics into plain-English root causes using Ollama, vLLM, or any OpenAI-compatible model in-cluster - Flexible On-Call Scheduling: Supports primary, secondary, and custom rotation layers with time-window restrictions and self-service overrides - Per-User Notification Rules: Customizable escalation paths (email, SMS, voice call) with individual engineer preferences - Air-Gapped Ready: Fully functional in isolated VPCs and classified environments with no outbound API calls required - SSO + Local Users: Entra ID, Okta, and Google Workspace integration with local accounts as break-glass options - PII Sanitization: Automatically strips sensitive data before AI processing - CVE Breach Intelligence: Daily scans against NVD, OSV, and CISA KEV with auto-generated fix PRs - Multi-Tenant Isolation: Complete data separation between teams - Read-Only by Design: Only queries infrastructure—never modifies or deploys anything Wachd is designed for Kubernetes environments with: - Helm Chart Deployment: Sane defaults with support for external RDS/ElastiCache or in-cluster Postgres/Redis - Flexible AI Backends: Works with Ollama, vLLM, TGI, LLMKube, or cloud AI (Claude, OpenAI, Gemini) - Zero Vendor Lock-in: Apache 2.0 licensed with no proprietary dependencies - Integrations: Grafana, Datadog, Prometheus, Loki, PagerDuty, GitHub, GitLab, Slack, Microsoft Teams, Twilio All incident data, logs, and analysis remain within your cluster, ensuring full data residency and compliance with GDPR requirements. - Open Source: Free self-hosted version with core AI analysis (Ollama), unlimited teams/users, and Apache 2.0 license - SMB: $99/month for cloud AI options (Claude, OpenAI, Gemini), 30-day incident history exports, and priority support - Enterprise: Custom pricing for regulated organizations with SSO and compliance features

Open-source transactional email platform
Plunk is an open-source, self-hostable email platform designed for transactional emails, marketing campaigns, and automated workflows. Built with privacy in mind, it offers transparent pricing, no contact limits, and full control over your email infrastructure. - Transactional & Marketing Emails: Send both transactional emails and marketing campaigns from a single platform. - Automated Workflows: Trigger workflows based on events sent from your code, with a visual canvas for full transparency. - Inbound Email Handling: Receive emails at your domain by adding an MX record, turning replies into contacts and triggering workflows. - Unlimited Contacts: Store unlimited contacts for free; pay only per email sent ($0.001 per email). - Self-Hosting & Open Source: Fully inspectable, forkable, and self-hostable under AGPL-3.0 license. - MCP Server Integration: Connect AI agents (Claude, Cursor) to manage emails via the Model Context Protocol. - Email Editor & SMTP: Visual editor for emails or direct HTML editing, plus SMTP support for existing clients. - Analytics & Segments: Track delivery, opens, clicks, and bounces per send, with dynamic segments that update in real-time. - License: AGPL-3.0 - Hosting: EU-based cloud or self-hosted via Docker Compose - GitHub Stars: 5,000+ - Setup Time: Under 5 minutes for domain configuration and first send - Exit Strategy: Full control via Docker Compose for seamless migration away from the cloud service.
About Opsgenie
Overview
Atlassian provides official migration resources to help teams transition from Opsgenie to Atlassian's incident management ecosystem. This guide includes step-by-step instructions, best practices, and tools to ensure a smooth migration process.
Key Features of Opsgenie
- Official Migration Documentation: Detailed guides and checklists for migrating from Opsgenie.
- Multi-language Support: Resources available in multiple languages including English, Chinese, German, French, Spanish, and more.
- Step-by-Step Instructions: Clear, actionable steps to migrate schedules, integrations, and configurations.
- Best Practices: Recommendations for minimizing downtime and ensuring data integrity during migration.
- Community Support: Access to Atlassian's support resources and community forums for assistance.
- Integration Compatibility: Guidance on migrating to Atlassian's native incident management tools.
Tech / Self-Hosting
- Self-Hosted: No, this is a cloud-based migration guide provided by Atlassian.
- Privacy & Compliance: Atlassian's solutions are designed with privacy and compliance in mind, adhering to GDPR and other regulatory standards.
- EU-Friendly: Yes, Atlassian is an EU-friendly company with GDPR-compliant practices.