8 Best Open Source Logz.io Alternatives
A curated collection of the 8 best open source and self-hosted alternatives to Logz.io in 2026.
Looking for a free, privacy-friendly, or self-hosted replacement for Logz.io in 2026? The top open-source alternative is SigNoz — Open-source Datadog alternative for full-stack observability.
Other highly rated open-source Logz.io alternatives include OpenObserve, Logstash and HyperDX.

Open-source Datadog alternative for full-stack observability
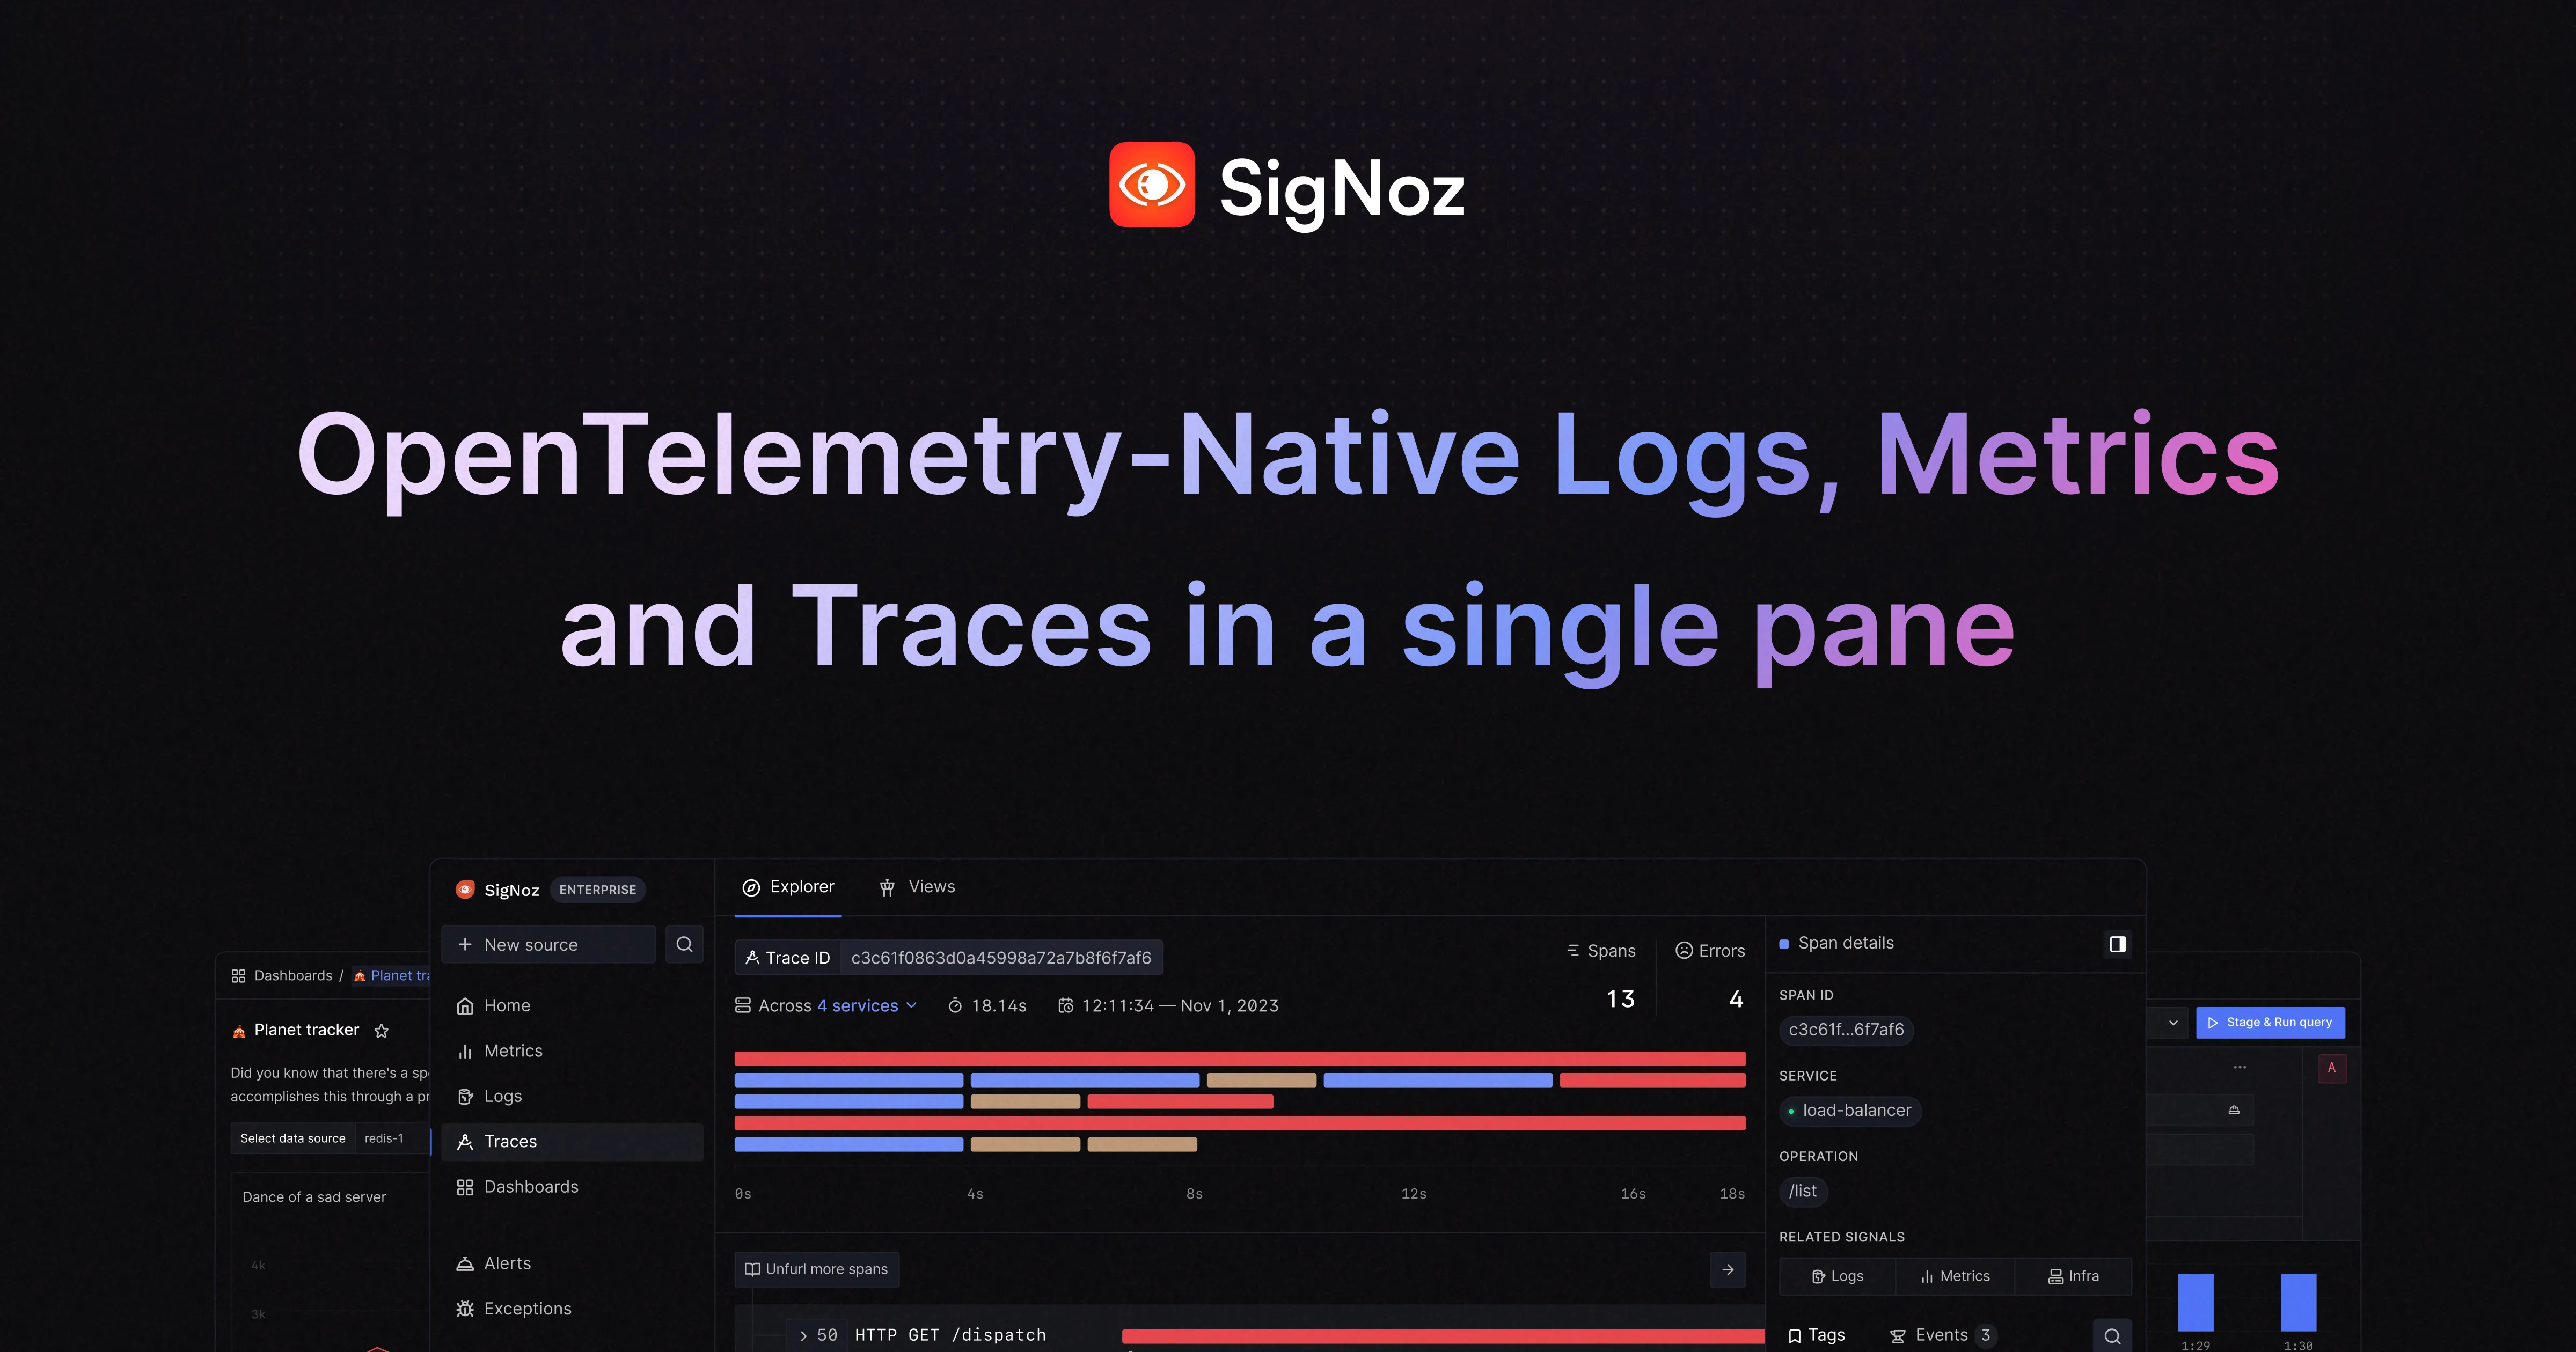
SigNoz is a modern observability platform designed to simplify monitoring, logging, and tracing for applications and AI agents. Built on open standards like OpenTelemetry, it consolidates APM, logs, metrics, exceptions, and AI observability into a single tool. - Full-Stack Observability: Monitor traces, metrics, logs, and exceptions in one platform - OpenTelemetry Native: Built on OpenTelemetry standards for vendor-neutral instrumentation - AI Observability: Specialized tools for monitoring AI agents and applications - Real-Time Alerts: Configurable alerting for anomalies and critical events - Unified Dashboard: Single interface for all observability data - Usage-Based Pricing: Simple, predictable pricing model - Self-Hosting: Deploy on your own infrastructure with Self-Hosted SigNoz - Agent-Native: Optimized for monitoring AI agents and their workflows SigNoz offers both cloud-hosted and self-hosted options. The self-hosted version can be deployed using Docker, Kubernetes, or Helm charts. It supports various data sources and integrates seamlessly with existing monitoring setups. The platform is designed for scalability and can handle high-volume telemetry data from distributed systems.

Open source observability platform for AI era
OpenObserve is a high-performance, unified observability platform designed for the AI era. It delivers 140x lower storage costs while maintaining enterprise-grade reliability and scalability. - Unified Observability: Monitor logs, metrics, traces, and AI workloads in a single platform - Petabyte-Scale Scalability: Handle massive data volumes efficiently - 90% Cost Savings: Significantly reduce infrastructure and storage expenses - AI-Powered Features: Includes AI SRE and AI assistant capabilities - Kubernetes Monitoring: Native support for containerized environments - LLM Observability: Specialized monitoring for large language models - Visualization & Dashboards: Advanced data visualization tools - Incident Management: Built-in incident tracking and alerting - Open Source Core: Fully open source with AGPL-3.0 license - Self-Hosting: Deployable via Docker or Kubernetes OpenObserve can be self-hosted with a single command: bash docker run \ -p 5080:5080 \ -e ZOROOTUSEREMAIL="[email protected]" \ -e ZOROOTUSERPASSWORD="Complexpass#123" \ o2cr.ai/openobserve/openobserve:latest The platform supports both cloud and on-premises deployments, with enterprise-grade security and compliance features. It's trusted by over 9,000 companies including Fortune 500 giants and innovative startups.

Open source log collection and processing pipeline

Logstash is a flexible, open-source data processing pipeline that integrates data from multiple sources, formats, and locations in real-time. As part of the Elastic Stack, it enables centralized log collection, parsing, and enrichment before indexing into Elasticsearch for storage and analysis. - Multi-source data ingestion: Collect logs from files, syslog, HTTP, databases, and cloud services - Real-time processing: Parse and transform logs as they arrive with customizable filters - Extensible plugin ecosystem: Over 200 plugins for input, filter, and output operations - Data enrichment: Add context to logs using geo-IP, user agent parsing, and custom lookups - Scalable architecture: Handle high-volume log streams with distributed processing - Integration with Elastic Stack: Seamless connection to Elasticsearch and Kibana for visualization - Flexible deployment: Run as standalone, in containers, or as part of Kubernetes clusters - Security features: TLS encryption, authentication, and role-based access control Logstash is open-source software that can be self-hosted on any infrastructure. It supports: - Standalone deployment: Single-node setup for development or small-scale use - Containerized deployment: Docker images available for easy container orchestration - Kubernetes integration: Helm charts for deploying in Kubernetes environments - Cloud deployment: Available as part of Elastic Cloud for managed hosting The software is written in JRuby and requires Java runtime environment. Configuration is done through a declarative pipeline definition file.

Open source observability platform for logs, traces and errors
HyperDX is an open source observability platform designed to help engineering teams resolve production issues faster. It unifies session replays, logs, traces, metrics, and errors into a single interface, eliminating the need for multiple tools. - End-to-End Tracing: Automatically trace requests from browser to backend servers and async workers - Blazing Fast Search: Search terabytes of events in seconds using ClickHouse - Intuitive Search Syntax: Simple full-text search without complex syntax requirements - Automatic Pattern Clustering: Aggregate log patterns and condense billions of events into distinctive clusters - Correlated Session Replays: Link session replays with backend logs and traces automatically - Visualization Tools: Build and share intuitive charts for logs, metrics, and traces - Automatic Instrumentation: Trace logs, API requests, DB queries with minimal code - Alerts & Notifications: Get notified via Slack, Email, or PagerDuty when issues occur - Intercom Integration: Jump directly from Intercom to user sessions and logs - Live Tail: View and search log streams in real-time - Native JSON Parsing: Search and graph structured JSON logs without configuration - Vendor Agnostic: Powered by OpenTelemetry for no vendor lock-in - Agent-Free Install: No additional agents, sidecars, or containers required HyperDX is built on ClickHouse and OpenTelemetry, making it highly scalable and compatible with various deployment environments. The platform offers both cloud-hosted and self-hosted options, with automatic instrumentation supporting multiple languages including Node.js, Python, Java, Go, Elixir, and React Native. Deployment is supported on Kubernetes, AWS EC2, Vercel, Fly.io, Heroku, and Cloudflare.
Cloud-native observability database unifying metrics, logs, and traces with sub-second queries, 50x cost reduction, and seamless OpenTelemetry integration.
Cloud-native observability database unifying metrics, logs, and traces with sub-second queries, 50x cost reduction, and seamless OpenTelemetry integration.

OpenTelemetry-native observability platform
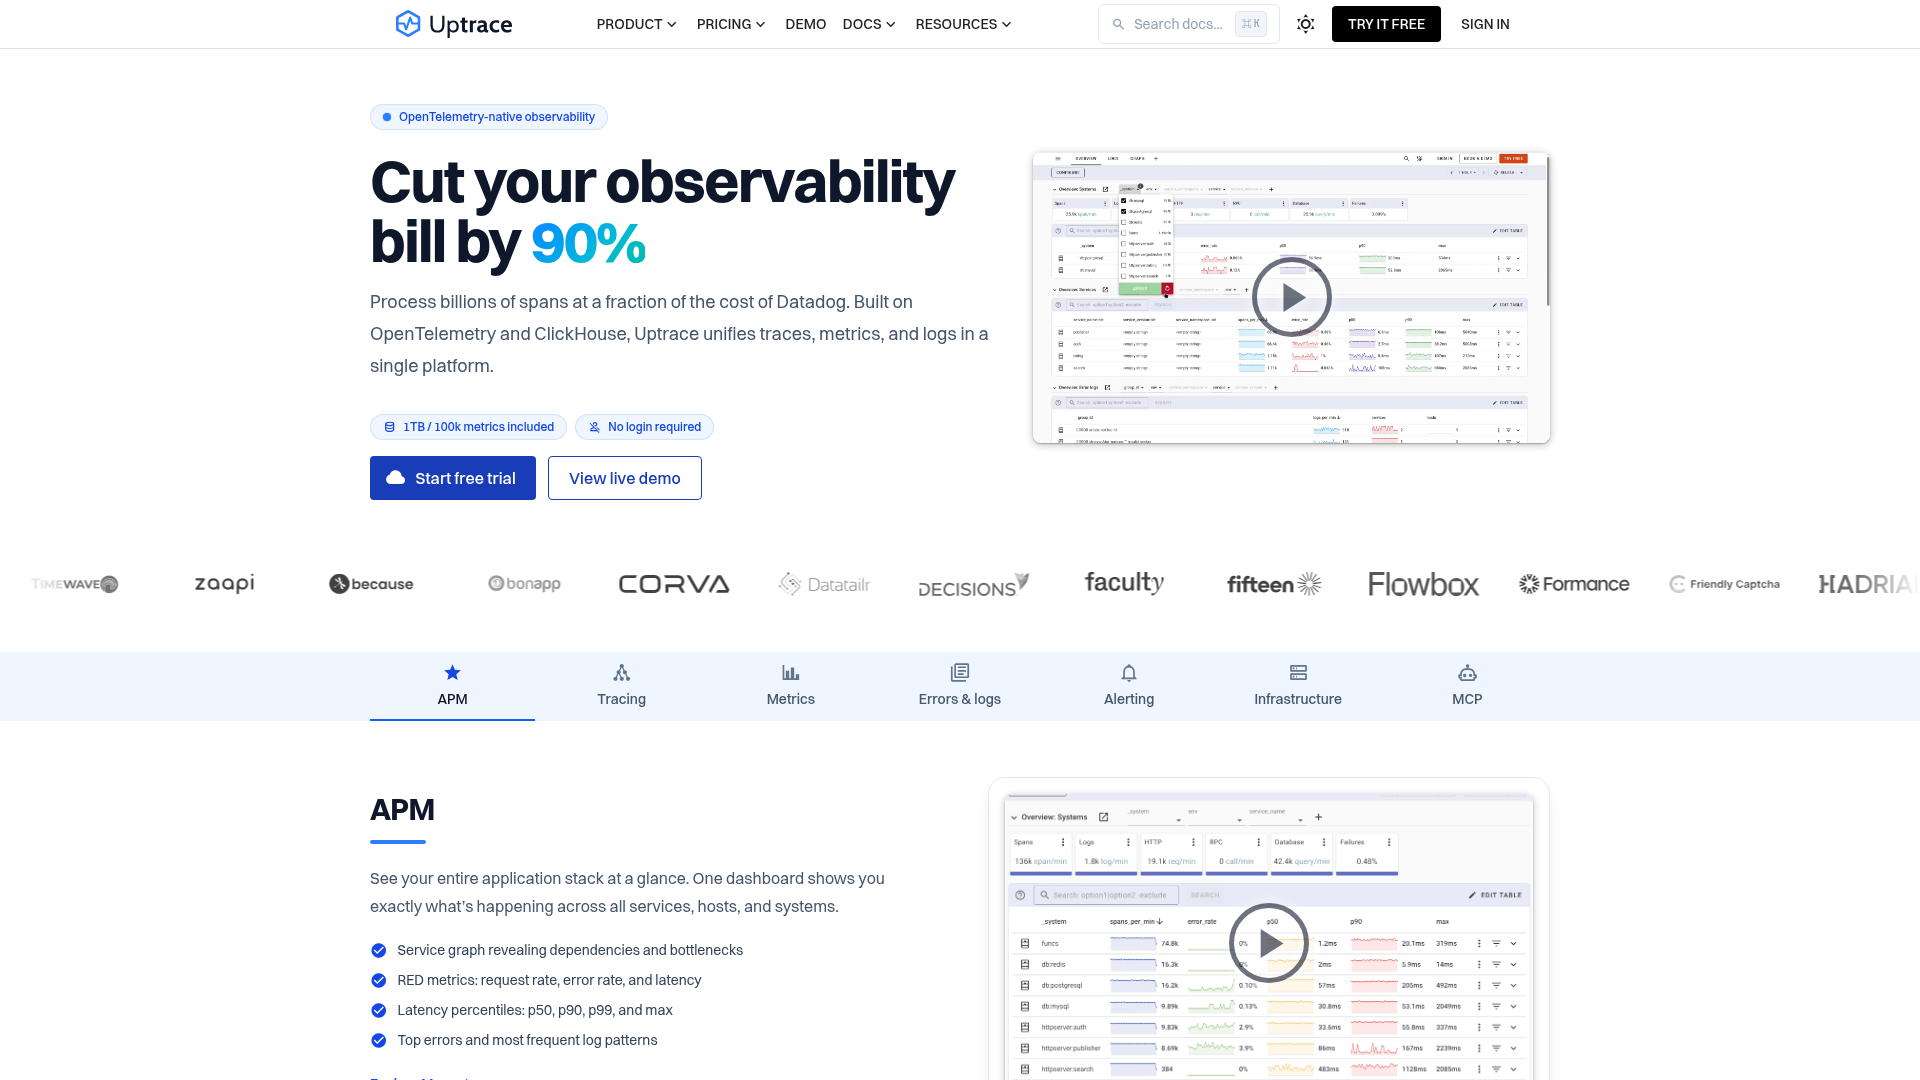
Uptrace is an OpenTelemetry-native observability platform that unifies traces, metrics, and logs in a single platform. Built on OpenTelemetry and ClickHouse, it processes billions of spans at a fraction of the cost of traditional observability tools like Datadog or New Relic. - All-in-one observability: Unified platform for traces, metrics, and logs with no need to stitch data together manually. - OpenTelemetry-native: Ingest data from OpenTelemetry, Prometheus, Vector, FluentBit, CloudWatch, and more. - Cost-effective pricing: Pay per GB ingested and active timeseries with no per-seat fees or hidden charges. - Self-hosting: Download from GitHub and own your data completely with no feature limits. - APM & Infrastructure Monitoring: Service graphs, RED metrics, latency percentiles, and top errors with infrastructure monitoring capabilities. - Alerting & MCP: Built-in alerting and MCP (Model Context Protocol) support for AI-driven observability. - Predictable pricing: Set monthly caps to avoid billing surprises and budget effectively. - Compliance-ready: Offers on-premise installations for organizations with strict compliance requirements. Uptrace is built on OpenTelemetry and ClickHouse, offering both cloud and self-hosted options. The self-hosted version is available as a free download from GitHub, allowing users to deploy on their own infrastructure. Uptrace Cloud provides a fully managed experience with enterprise-grade support and compliance options. The platform is designed to scale from small applications to enterprise-level deployments, handling high-volume data ingestion efficiently.

Open-source observability for traces, logs & metrics
Maple is an open-source observability platform designed for modern applications. Built on OpenTelemetry and powered by ClickHouse, it enables teams to collect, visualize, and analyze distributed traces, logs, and metrics with sub-second query performance. - Unified Observability: Collect and correlate traces, logs, and metrics from all services in one platform - AI-Powered Diagnostics: Leverage AI agents to automatically analyze incidents and propose fixes - Real-Time Incident Response: Follow requests end-to-end with complete context and correlated data - Service Catalog & Maps: Visualize live request flows and service dependencies - Error Tracking: Group errors by type with trends, affected services, and sample traces - Metrics & Dashboards: Customizable dashboards for request rate, error rate, and latency percentiles - Alerting with Context: Receive alerts with attached traces, logs, and relevant context - MCP Server Integration: First-class MCP support for AI agents to interact with your observability data Maple is open-source and can be self-hosted. The platform is built on OpenTelemetry standards and uses ClickHouse for high-performance data storage and querying. Local deployment is available as a single binary for easy setup and management.
Unified platform for logs, metrics, traces and profiles with native compatibility for popular tools like OpenTelemetry, Prometheus, and Loki. No data silos, no usage limits.
Unified platform for logs, metrics, traces and profiles with native compatibility for popular tools like OpenTelemetry, Prometheus, and Loki. No data silos, no usage limits.
About Logz.io
Cloud-based observability platform that centralizes logs, metrics, and traces using the ELK Stack and Grafana, giving engineering teams a managed alternative to running their own open source monitoring infrastructure.