10 Best Open Source Grafana Cloud Alternatives
A curated collection of the 10 best open source and self-hosted alternatives to Grafana Cloud in 2026.
Looking for a free, privacy-friendly, or self-hosted replacement for Grafana Cloud in 2026? The top open-source alternative is Grafana — Grafana unifies metrics, logs, traces, profiles, and business data into one OpenTelemetry-native platform with AI-assisted root cause analysis and adaptive cost controls..
Other highly rated open-source Grafana Cloud alternatives include NetData, Prometheus and SigNoz.
Grafana unifies metrics, logs, traces, profiles, and business data into one OpenTelemetry-native platform with AI-assisted root cause analysis and adaptive cost controls.
Grafana unifies metrics, logs, traces, profiles, and business data into one OpenTelemetry-native platform with AI-assisted root cause analysis and adaptive cost controls.

Real-time infrastructure monitoring with AI troubleshooting
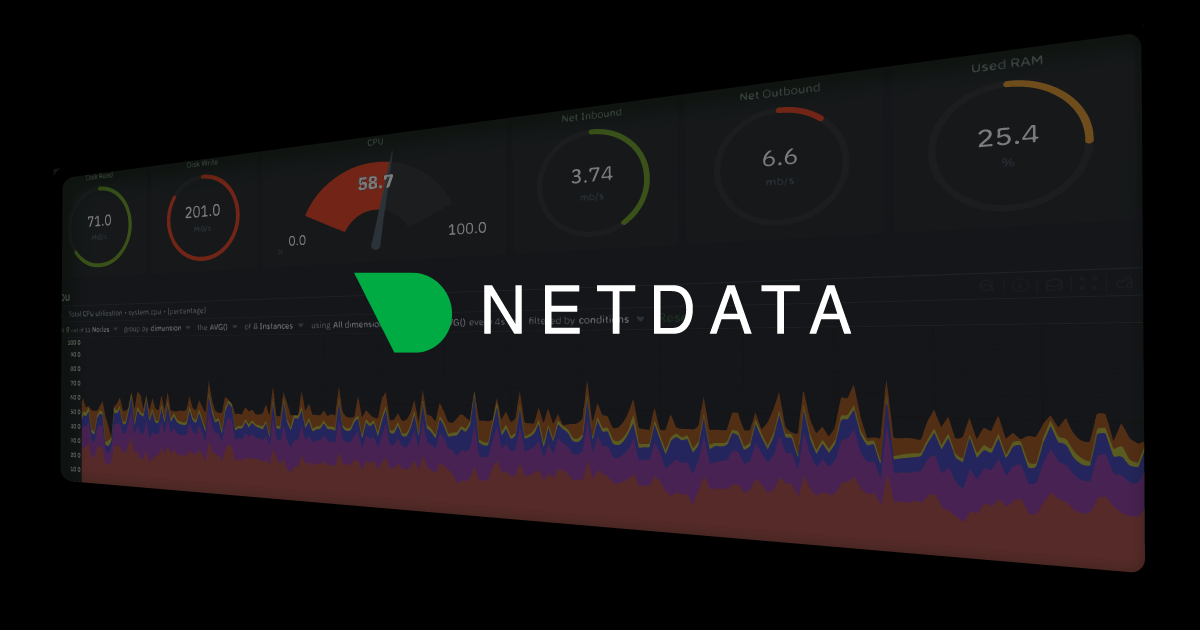
Netdata is a real-time infrastructure monitoring solution designed to transform how teams observe, troubleshoot, and optimize their systems. With per-second metrics collection, unsupervised machine learning for anomaly detection, and AI-driven troubleshooting capabilities, Netdata provides actionable insights to reduce downtime and improve system performance. - Per-second metrics collection for granular system visibility - Unsupervised ML anomaly detection with automatic alerting - AI Co-Engineer for intelligent troubleshooting and root cause analysis - Anomaly Advisor to identify and explain performance issues - Blast Radius Detection to pinpoint affected system components - Zero-configuration deployment with algorithmic dashboards - Distributed observability pipeline for scalable monitoring - Edge computing support for distributed environments - Tiered retention with infinite scalability - eBPF monitoring for deep system-level insights - OpenTelemetry integration for standardized observability - Real-time network monitoring with topology visualization - Custom dashboards without requiring query languages - Mobile apps for monitoring on-the-go - Enterprise access control and zero-code instrumentation Netdata is open-source and can be self-hosted on Linux systems. The platform supports both cloud-based and on-premises deployments, with options for Netdata Agents, Netdata Parents, and Netdata Cloud. The software is designed for extreme cardinality handling and real-time performance at scale, making it suitable for large-scale infrastructure monitoring.

Open-source monitoring & time series database

Prometheus is an open-source monitoring system and time series database designed for cloud-native environments. It provides a flexible dimensional data model, a powerful PromQL query language, and efficient alerting mechanisms. - Dimensional data model: Identifies time series by metric names and key-value pairs for flexible data organization. - PromQL query language: Enables powerful querying, correlation, and transformation of time series data for visualizations and alerts. - Precise alerting: Uses Alertmanager to handle notifications and silencing based on PromQL rules. - Simple operation: Operates independently with local storage, deployable as statically linked binaries across environments. - Instrumentation libraries: Offers official and community-contributed libraries for metrics instrumentation in major languages. - Ubiquitous integrations: Includes hundreds of official and community integrations for extracting metrics from existing systems. - Cloud-native integration: Works seamlessly with Kubernetes and other cloud/container managers for continuous service discovery and monitoring. - Open governance: A CNCF graduated project with 100% open-source components under the Apache 2 License. Prometheus is 100% open-source and self-hostable, with all components available under the Apache 2 License. It is developed in Go and designed for easy deployment across various environments, including Kubernetes and cloud infrastructures. The system operates independently with local storage, ensuring minimal external dependencies.

Open-source Datadog alternative for full-stack observability
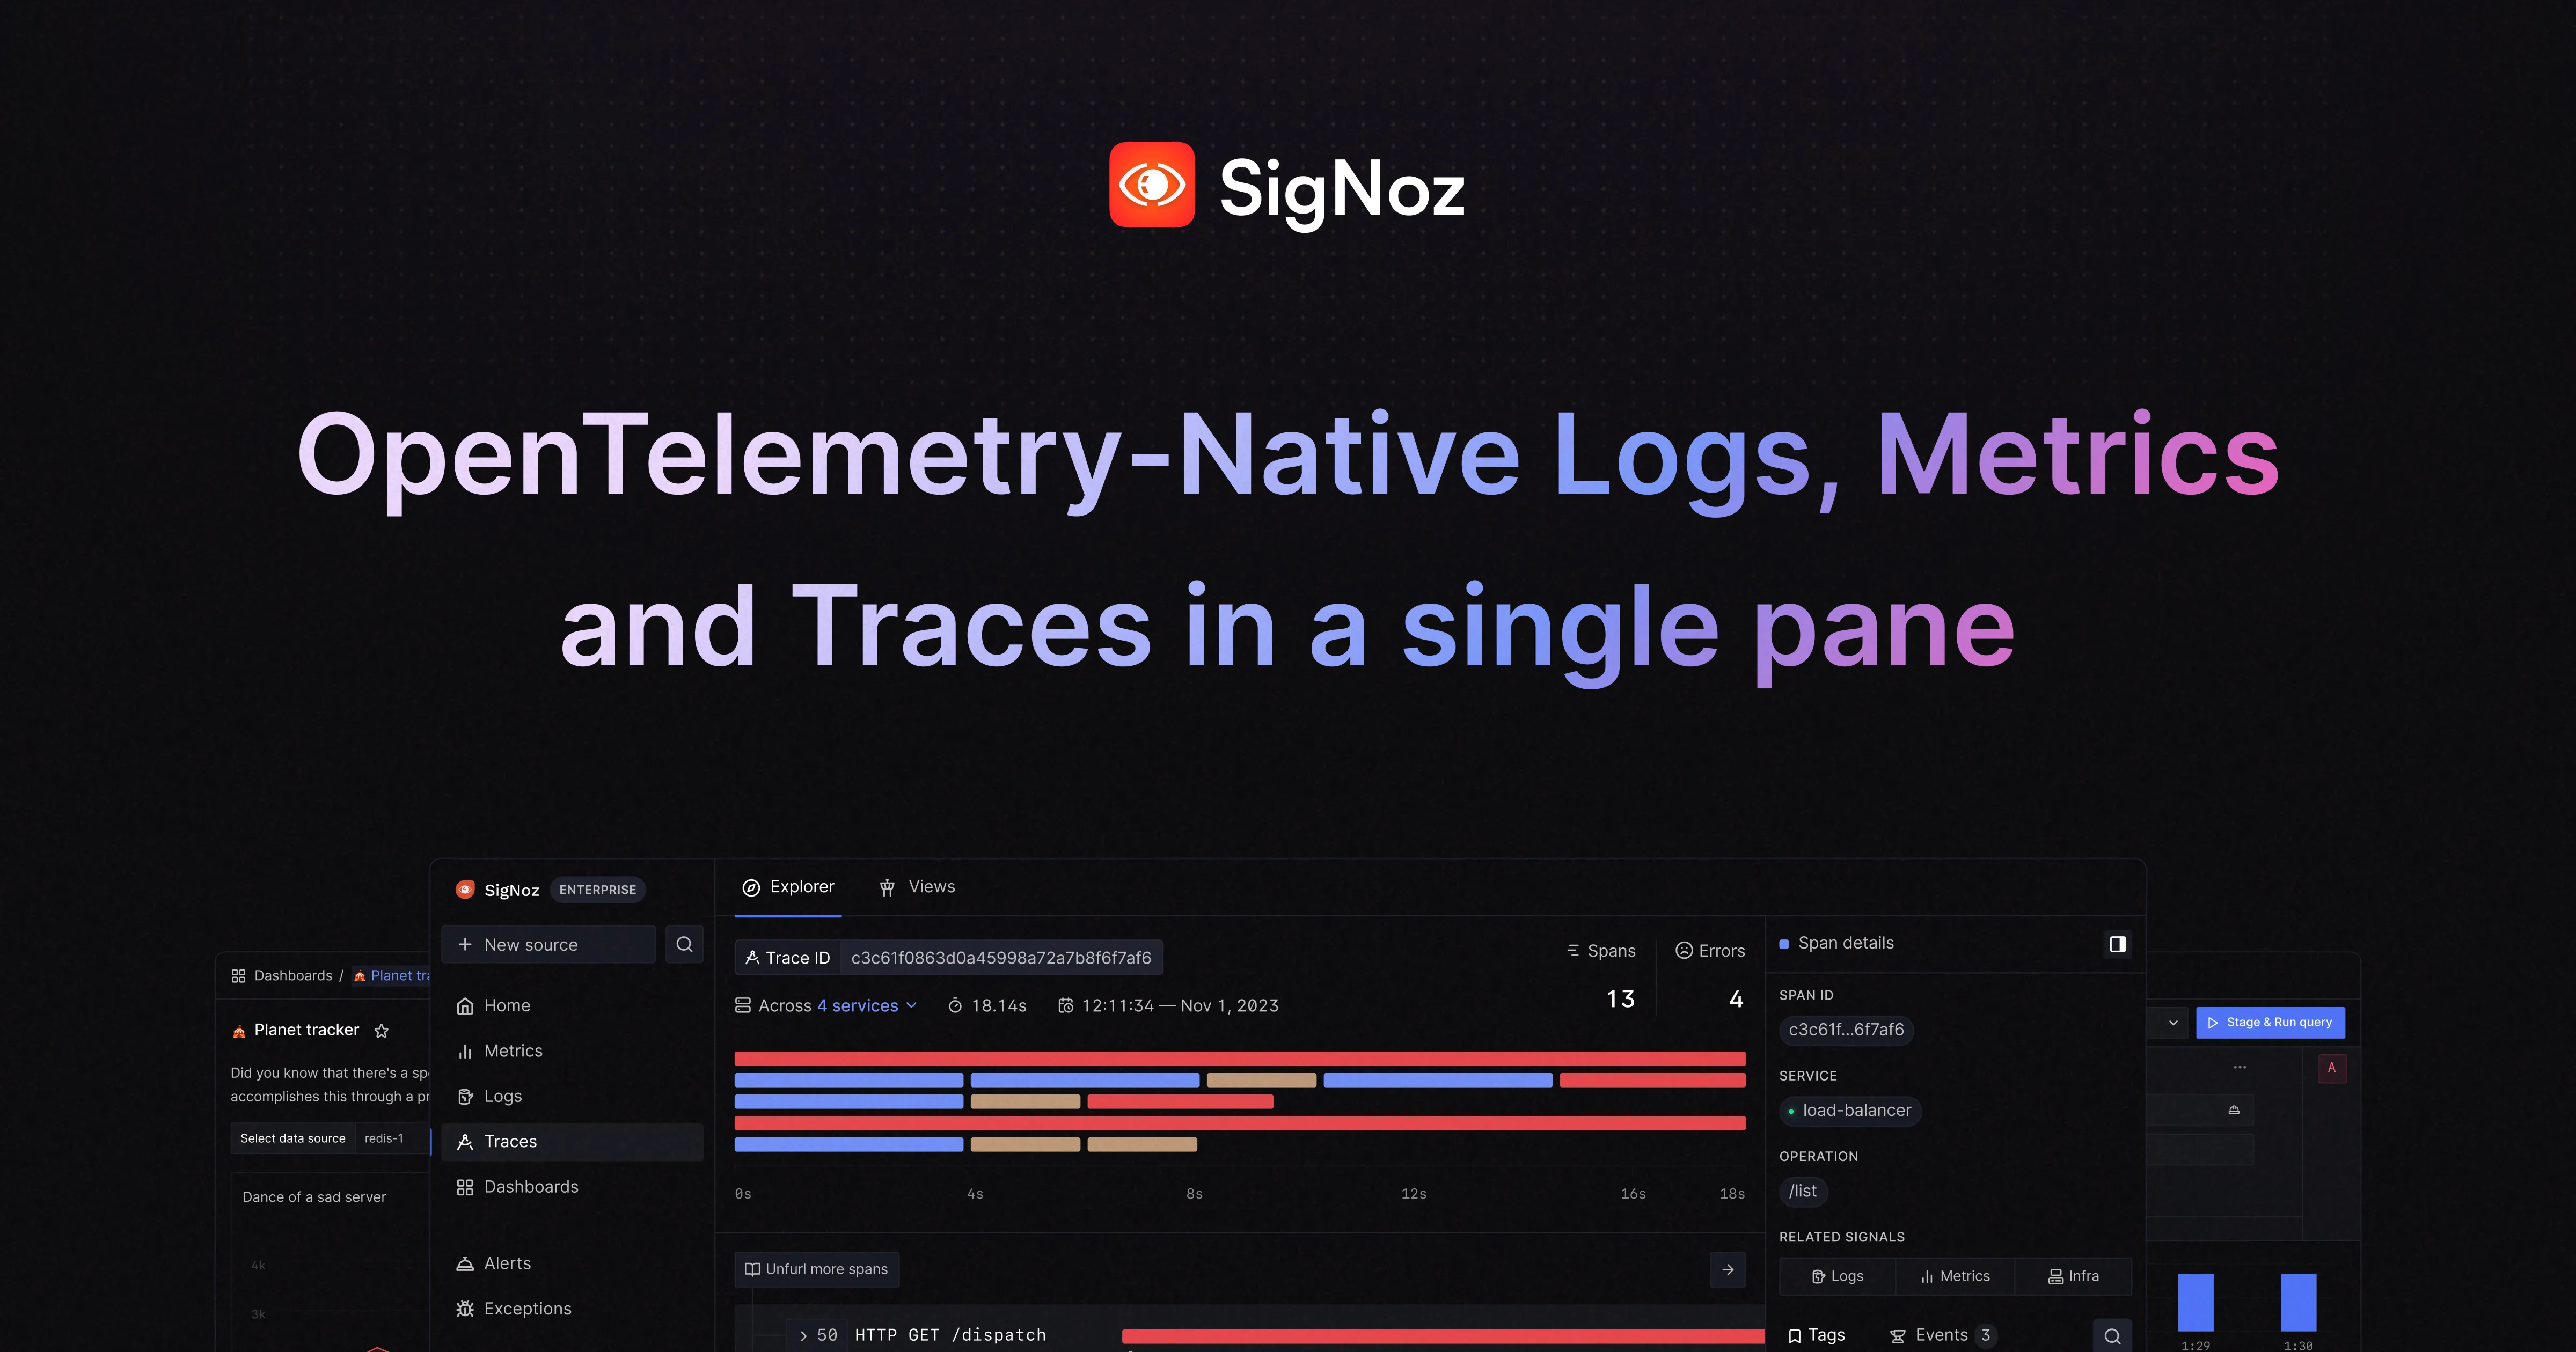
SigNoz is a modern observability platform designed to simplify monitoring, logging, and tracing for applications and AI agents. Built on open standards like OpenTelemetry, it consolidates APM, logs, metrics, exceptions, and AI observability into a single tool. - Full-Stack Observability: Monitor traces, metrics, logs, and exceptions in one platform - OpenTelemetry Native: Built on OpenTelemetry standards for vendor-neutral instrumentation - AI Observability: Specialized tools for monitoring AI agents and applications - Real-Time Alerts: Configurable alerting for anomalies and critical events - Unified Dashboard: Single interface for all observability data - Usage-Based Pricing: Simple, predictable pricing model - Self-Hosting: Deploy on your own infrastructure with Self-Hosted SigNoz - Agent-Native: Optimized for monitoring AI agents and their workflows SigNoz offers both cloud-hosted and self-hosted options. The self-hosted version can be deployed using Docker, Kubernetes, or Helm charts. It supports various data sources and integrates seamlessly with existing monitoring setups. The platform is designed for scalability and can handle high-volume telemetry data from distributed systems.
Open source observability platform for AI era
OpenObserve is a high-performance, unified observability platform designed for the AI era. It delivers 140x lower storage costs while maintaining enterprise-grade reliability and scalability. - Unified Observability: Monitor logs, metrics, traces, and AI workloads in a single platform - Petabyte-Scale Scalability: Handle massive data volumes efficiently - 90% Cost Savings: Significantly reduce infrastructure and storage expenses - AI-Powered Features: Includes AI SRE and AI assistant capabilities - Kubernetes Monitoring: Native support for containerized environments - LLM Observability: Specialized monitoring for large language models - Visualization & Dashboards: Advanced data visualization tools - Incident Management: Built-in incident tracking and alerting - Open Source Core: Fully open source with AGPL-3.0 license - Self-Hosting: Deployable via Docker or Kubernetes OpenObserve can be self-hosted with a single command: bash docker run \ -p 5080:5080 \ -e ZOROOTUSEREMAIL="[email protected]" \ -e ZOROOTUSERPASSWORD="Complexpass#123" \ o2cr.ai/openobserve/openobserve:latest The platform supports both cloud and on-premises deployments, with enterprise-grade security and compliance features. It's trusted by over 9,000 companies including Fortune 500 giants and innovative startups.

Fast, scalable observability database for metrics, logs and traces
VictoriaMetrics is a fast, cost-effective, and scalable monitoring solution for metrics, logs, and traces. It provides high-performance time-series databases designed for observability at scale. - High Performance: Optimized for fast data ingestion and query processing, handling millions of metrics per second. - Scalability: Supports horizontal scaling for large-scale deployments with minimal overhead. - Multi-Data Support: Includes VictoriaMetrics (metrics), VictoriaLogs (logs), and VictoriaTraces (traces) for comprehensive observability. - Open Source Core: Core components are open-source with enterprise-grade features available in the commercial version. - Compatibility: Compatible with Prometheus, Grafana, and other observability tools. - Enterprise Features: Offers advanced features like anomaly detection, long-term storage, and high availability. - Cloud & Self-Hosted: Available as a managed cloud service or self-hosted solution. - Cost-Effective: Reduces storage and compute costs compared to traditional monitoring solutions. VictoriaMetrics can be deployed on-premises or in the cloud. It supports Kubernetes, Docker, and bare-metal installations. The open-source version is available under the Apache 2.0 license, while enterprise features require a commercial license. Documentation and community support are provided for self-hosting.

Open source observability platform for logs, traces and errors
HyperDX is an open source observability platform designed to help engineering teams resolve production issues faster. It unifies session replays, logs, traces, metrics, and errors into a single interface, eliminating the need for multiple tools. - End-to-End Tracing: Automatically trace requests from browser to backend servers and async workers - Blazing Fast Search: Search terabytes of events in seconds using ClickHouse - Intuitive Search Syntax: Simple full-text search without complex syntax requirements - Automatic Pattern Clustering: Aggregate log patterns and condense billions of events into distinctive clusters - Correlated Session Replays: Link session replays with backend logs and traces automatically - Visualization Tools: Build and share intuitive charts for logs, metrics, and traces - Automatic Instrumentation: Trace logs, API requests, DB queries with minimal code - Alerts & Notifications: Get notified via Slack, Email, or PagerDuty when issues occur - Intercom Integration: Jump directly from Intercom to user sessions and logs - Live Tail: View and search log streams in real-time - Native JSON Parsing: Search and graph structured JSON logs without configuration - Vendor Agnostic: Powered by OpenTelemetry for no vendor lock-in - Agent-Free Install: No additional agents, sidecars, or containers required HyperDX is built on ClickHouse and OpenTelemetry, making it highly scalable and compatible with various deployment environments. The platform offers both cloud-hosted and self-hosted options, with automatic instrumentation supporting multiple languages including Node.js, Python, Java, Go, Elixir, and React Native. Deployment is supported on Kubernetes, AWS EC2, Vercel, Fly.io, Heroku, and Cloudflare.
Cloud-native observability database unifying metrics, logs, and traces with sub-second queries, 50x cost reduction, and seamless OpenTelemetry integration.
Cloud-native observability database unifying metrics, logs, and traces with sub-second queries, 50x cost reduction, and seamless OpenTelemetry integration.

OpenTelemetry-native observability platform
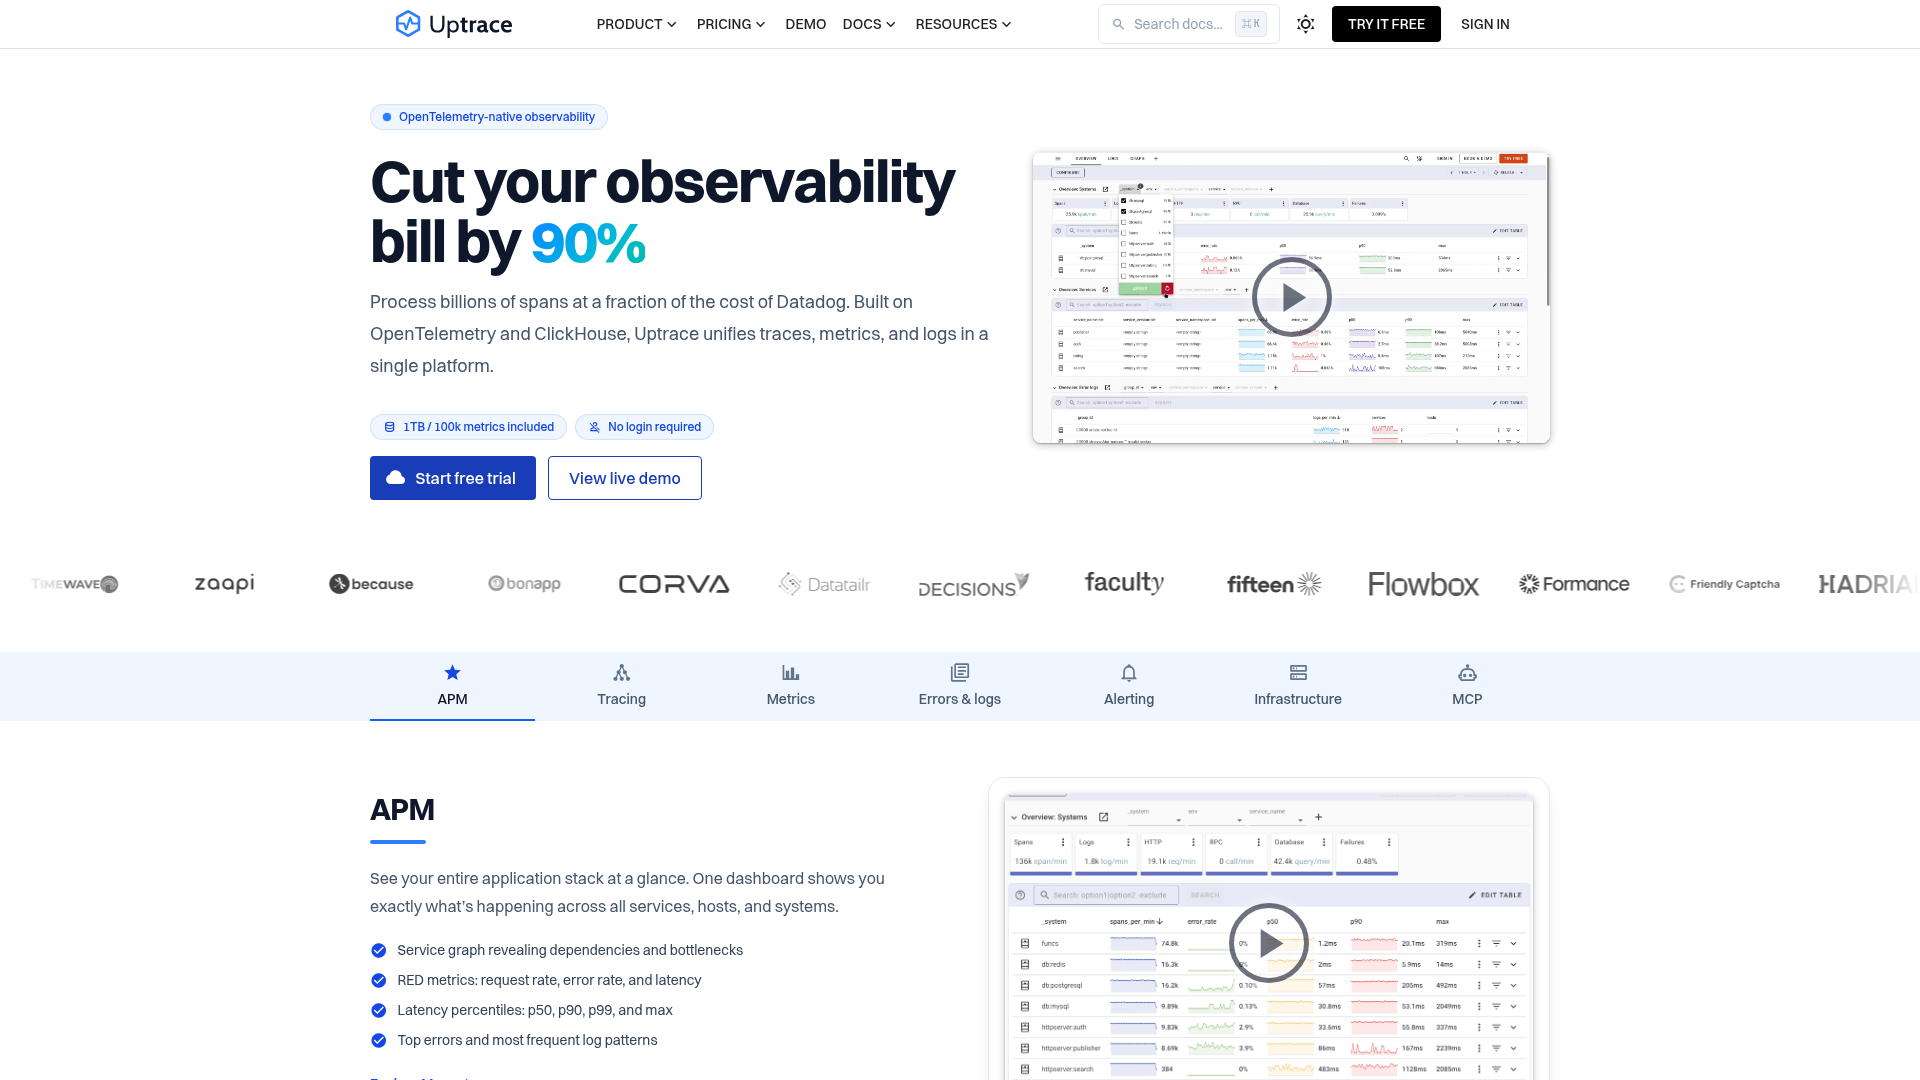
Uptrace is an OpenTelemetry-native observability platform that unifies traces, metrics, and logs in a single platform. Built on OpenTelemetry and ClickHouse, it processes billions of spans at a fraction of the cost of traditional observability tools like Datadog or New Relic. - All-in-one observability: Unified platform for traces, metrics, and logs with no need to stitch data together manually. - OpenTelemetry-native: Ingest data from OpenTelemetry, Prometheus, Vector, FluentBit, CloudWatch, and more. - Cost-effective pricing: Pay per GB ingested and active timeseries with no per-seat fees or hidden charges. - Self-hosting: Download from GitHub and own your data completely with no feature limits. - APM & Infrastructure Monitoring: Service graphs, RED metrics, latency percentiles, and top errors with infrastructure monitoring capabilities. - Alerting & MCP: Built-in alerting and MCP (Model Context Protocol) support for AI-driven observability. - Predictable pricing: Set monthly caps to avoid billing surprises and budget effectively. - Compliance-ready: Offers on-premise installations for organizations with strict compliance requirements. Uptrace is built on OpenTelemetry and ClickHouse, offering both cloud and self-hosted options. The self-hosted version is available as a free download from GitHub, allowing users to deploy on their own infrastructure. Uptrace Cloud provides a fully managed experience with enterprise-grade support and compliance options. The platform is designed to scale from small applications to enterprise-level deployments, handling high-volume data ingestion efficiently.

Open-source observability for traces, logs & metrics
Maple is an open-source observability platform designed for modern applications. Built on OpenTelemetry and powered by ClickHouse, it enables teams to collect, visualize, and analyze distributed traces, logs, and metrics with sub-second query performance. - Unified Observability: Collect and correlate traces, logs, and metrics from all services in one platform - AI-Powered Diagnostics: Leverage AI agents to automatically analyze incidents and propose fixes - Real-Time Incident Response: Follow requests end-to-end with complete context and correlated data - Service Catalog & Maps: Visualize live request flows and service dependencies - Error Tracking: Group errors by type with trends, affected services, and sample traces - Metrics & Dashboards: Customizable dashboards for request rate, error rate, and latency percentiles - Alerting with Context: Receive alerts with attached traces, logs, and relevant context - MCP Server Integration: First-class MCP support for AI agents to interact with your observability data Maple is open-source and can be self-hosted. The platform is built on OpenTelemetry standards and uses ClickHouse for high-performance data storage and querying. Local deployment is available as a single binary for easy setup and management.
About Grafana Cloud
Grafana Cloud is a leading AI-powered, fully managed observability platform built on open source tools. It provides unified monitoring for metrics, logs, traces, and profiles, enabling engineering teams to quickly understand systems, resolve incidents, and improve AI applications.
Key Features of Grafana Cloud
- Full-Stack Observability: Monitor metrics, logs, traces, and profiles in a single platform.
- AI-Powered Insights: Leverage Grafana Assistant, Investigations, and Agent Observability for faster incident resolution and system understanding.
- Adaptive Telemetry: Automatically amplify critical signals to reduce costs by 35-50% while maintaining visibility.
- OpenTelemetry-Native: Standardize with open standards and connect existing tools seamlessly.
- Incident Response: Act decisively with context-rich alerts and AI-powered agents to reduce alert fatigue.
- Cost Control: Scale confidently with flexible tiers designed for teams of all sizes, from startups to Fortune 500 enterprises.
- Security & Compliance: Enterprise-grade security with SOC 2, GDPR, PCI, and FedRAMP High compliance.
- No Vendor Lock-in: Flexible, open platform that integrates with your existing stack.
Tech / Self-Hosting
Grafana Cloud is a fully managed SaaS solution provided by Grafana Labs. It is not self-hosted but offers extensive integration capabilities with self-hosted Grafana instances and open source tools like OpenTelemetry. The platform is designed for scalability and reliability, with enterprise-grade security and compliance certifications.