7 Best Open Source Cronitor Alternatives
A curated collection of the 7 best open source and self-hosted alternatives to Cronitor in 2026.
Looking for a free, privacy-friendly, or self-hosted replacement for Cronitor in 2026? The top open-source alternative is Uptime Kuma — Self-hosted website monitoring tool.
Other highly rated open-source Cronitor alternatives include Checkmate, Gatus and OpenStatus.

Self-hosted website monitoring tool
Uptime Kuma is a lightweight, self-hosted monitoring tool designed for developers and small teams. It provides real-time monitoring of websites and services, tracking uptime, response times, and status pages with minimal resource usage. - Real-time Monitoring: Tracks uptime and response times of websites and services. - Status Pages: Public or private status pages to communicate service status. - Notifications: Supports multiple notification channels (Discord, Slack, Telegram, etc.). - Multi-language: Available in multiple languages for global accessibility. - Lightweight: Runs efficiently on low-resource systems. - Docker Support: Easy deployment via Docker containers. - Customizable: Configure checks, intervals, and thresholds. - Open Source: Fully open-source with community-driven development. Uptime Kuma is built with Node.js and can be self-hosted on any system with Docker support. It requires minimal setup and is compatible with most cloud and on-premise environments. The project is actively maintained and welcomes contributions from the community.

Open-source infrastructure monitoring tool
Checkmate is an open-source, self-hosted infrastructure monitoring tool designed for teams who value control over their data and costs. Monitor servers, websites, Docker containers, and game servers with real-time uptime tracking, performance metrics, and multi-channel alerts. - Uptime Monitoring: Track HTTP, ping, TCP, gRPC, DNS, SSL, WebSocket, and PageSpeed endpoints from 6 continents with GlobalPing. - Infrastructure Monitoring: Monitor CPU, memory, disk, and network usage across all servers with live gauges and historical charts. - Docker Monitoring: Track container health, resource usage, and restart events for services like nginx, postgres, and redis. - Game Server Monitoring: Monitor Minecraft, CS2, Valheim, and other game servers with player counts. - Multi-Channel Alerts: Receive notifications via email, Slack, Discord, Telegram, Twilio SMS, Pushover, Matrix, ntfy, or custom webhooks. - Public Status Pages: Create customizable status pages to keep users informed during incidents. - Response Time Tracking: Monitor and analyze response times with historical charts and performance insights. - Team Collaboration: Invite team members with role-based access control (Admin, Editor, Viewer). - Global Uptime Monitoring: Deploy Checkmate via Docker Compose, Helm, or bare metal for flexible scaling. - Deployment Options: Docker Compose (5-minute setup), Helm charts, or bare metal. - License: AGPL-3.0 (fully open-source with no vendor lock-in). - Data Privacy: All metrics and data remain within your infrastructure—nothing leaves your perimeter. - Scalability: Designed for teams of all sizes, from small setups to enterprise environments. - Integrations: Plugs into existing tools like Slack, Discord, Telegram, and webhooks for seamless workflows.

Automated status pages with advanced uptime monitoring

Gatus is an open-source status page and uptime monitoring tool designed to help teams track the health of their services with precision. Whether you're monitoring simple HTTP endpoints or complex multi-step workflows, Gatus provides the flexibility to set custom health check conditions and receive immediate notifications when issues arise. - Comprehensive Uptime Monitoring: Track HTTP/HTTPS, DNS, TCP, ICMP endpoints with custom conditions. Validate JSON responses, check SSL certificates, and monitor response times for complete service health visibility. - Test Suites for Complex Workflows: Execute sequential endpoint tests with shared context to validate entire business processes, authentication flows, CRUD operations, and end-to-end transactions. - Instant Alerting: Receive downtime notifications via Slack, Discord, PagerDuty, email, and 15+ other platforms. Configure custom thresholds and escalation rules for proactive incident management. - Public Status Pages: Create transparent, user-focused status pages that automatically update based on real-time monitoring data. Display incident reports, maintenance schedules, and resolution timelines with color-coded priority levels. - Push-Based Monitoring: Monitor services in private networks using custom agents that push status updates to Gatus, eliminating the need to expose internal systems to the internet. - Developer-Friendly API: Integrate uptime checks with CI/CD pipelines, webhook monitoring, and comprehensive logging for technical diagnostics and issue resolution. - SSL Certificate Monitoring: Track SSL certificate expiration dates to prevent unexpected outages due to expired certificates. - Custom Health Check Conditions: Go beyond simple ping checks by validating specific response codes, JSON payloads, and custom monitoring logic tailored to your services. Gatus is built on open-source technology and can be self-hosted for complete control over your monitoring infrastructure. The project is actively maintained on GitHub with transparent development and community contributions. The software is lightweight, easy to deploy, and designed for scalability to handle monitoring needs of any size.

Free & open source status page for teams
OpenStatus provides a professional status page and uptime monitoring solution trusted by growing teams. Whether hosted or self-hosted, it helps organizations communicate incidents effectively, demonstrate compliance readiness, and maintain audit trails automatically. - Branded Status Pages: Create custom status pages on your own domain with themes, custom domains, and password protection options. - Uptime Monitoring: Monitor endpoints from 28 regions across multiple clouds with instant alerts via Slack, Discord, PagerDuty, or email. - Automated Incident Communication: Status page updates automatically during incidents with timestamped reports for audit trails. - Compliance Ready: SOC 2 compliant incident communication with documented, timestamped status reports that satisfy auditor requirements. - Programmatic Access: Manage everything via CLI, API (with OpenAPI spec), MCP server for AI agents, or Terraform provider. - Global Speed Checker: Test any URL's response time from 28 regions without account creation or credit card. - Enterprise Features: Themes, maintenance windows, subscriptions, and public or private status pages. OpenStatus is open source and self-hostable. The project is available on GitHub with comprehensive documentation for deployment and management. The platform supports both managed SaaS and self-hosted options, making it suitable for organizations of all sizes.

Open-source cron job monitoring service
Healthchecks is an open-source cron job and background task monitoring service that helps you ensure your scheduled tasks run as expected. - Cron Job Monitoring: Tracks cron jobs and background tasks to detect failures or hangs. - Alerting: Sends notifications via email, Slack, or other integrations when jobs fail or exceed expected runtime. - Simple Setup: Easy to deploy with Docker or Python/Django, requiring minimal configuration. - Web Dashboard: Provides a clean interface to view job statuses, logs, and history. - API Integration: Offers a RESTful API for seamless integration with existing workflows. - Self-Hosted: Fully open-source and self-hostable, ensuring data privacy and control. - Tech Stack: Built with Python and Django. - Deployment: Available as a Docker container or can be installed directly on a server. - Database Support: Works with PostgreSQL, MySQL, and SQLite. - Hosting: Self-hosted, making it ideal for privacy-conscious users and organizations.

Self-hosted uptime monitoring for websites and APIs
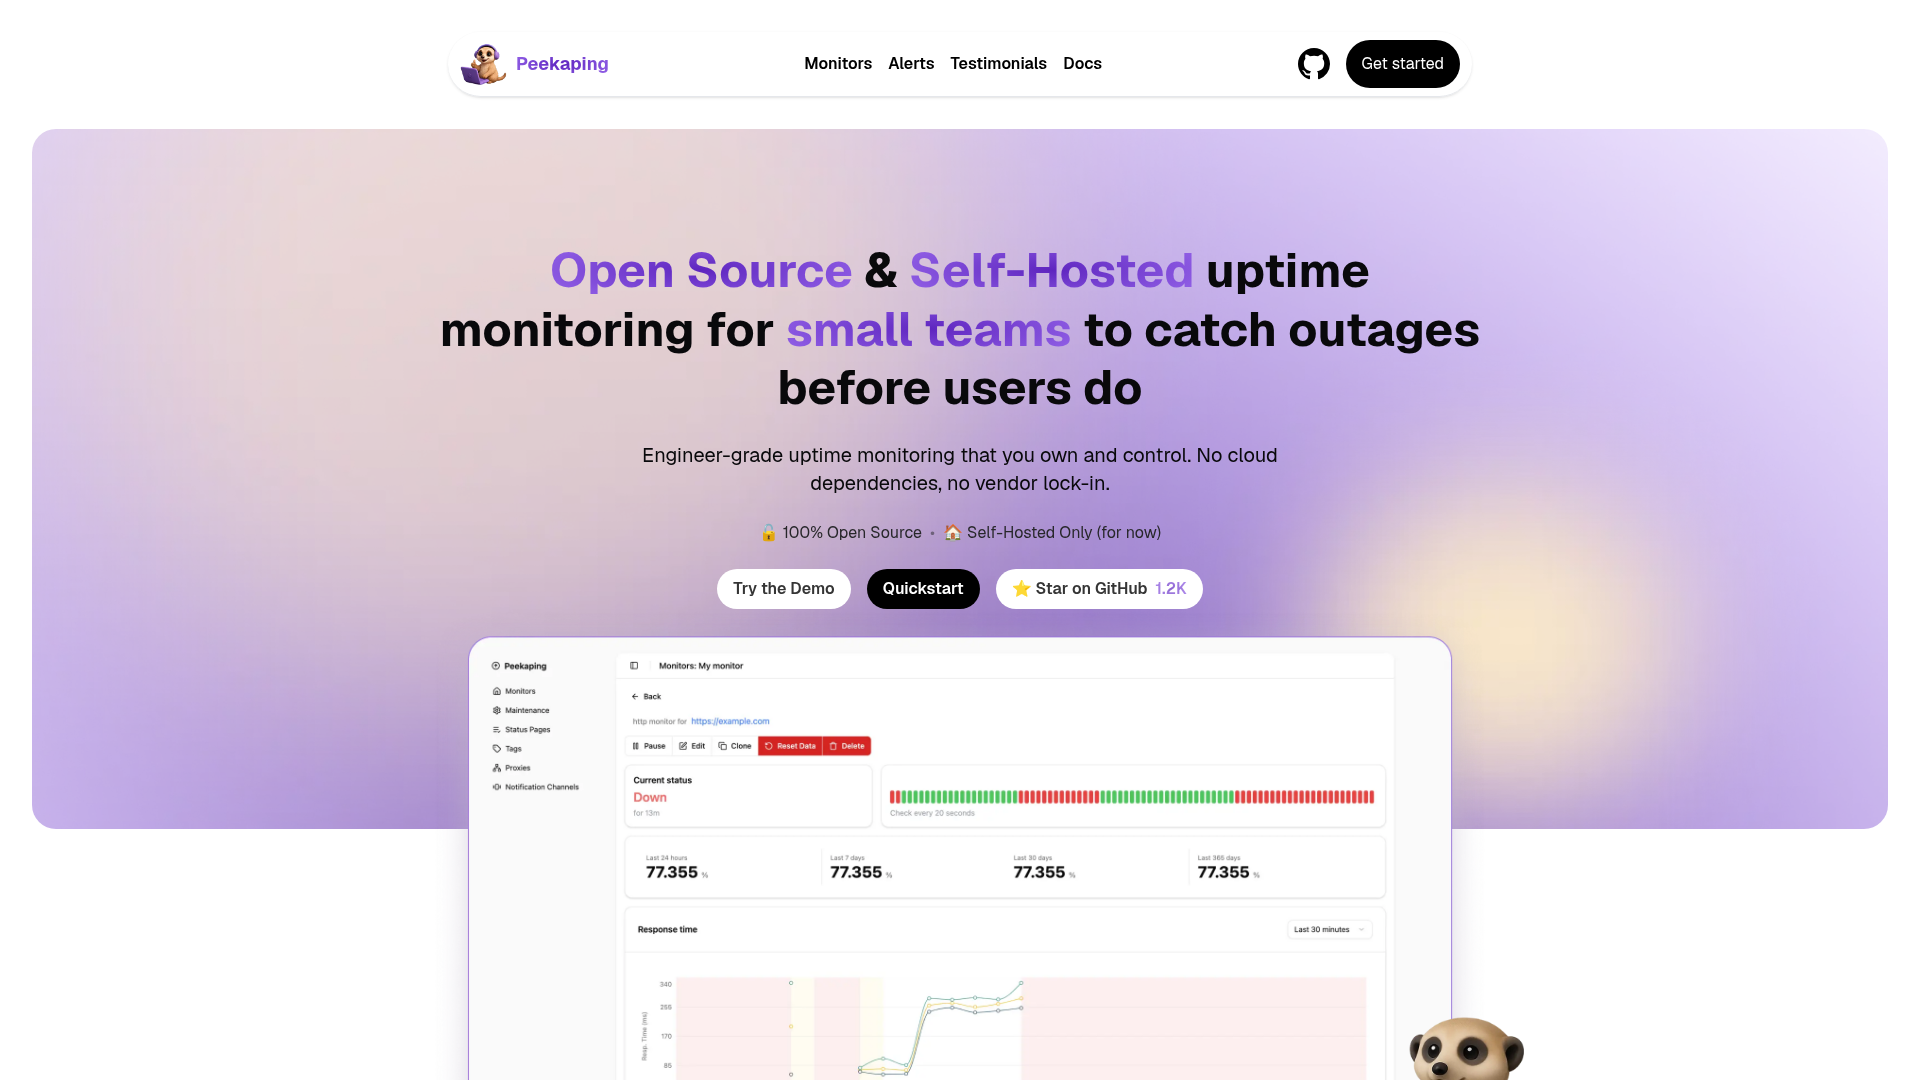
Peekaping is an open-source, self-hosted uptime monitoring solution designed for small teams and businesses that need to catch outages before users do. Built with Go and React, it provides engineer-grade monitoring with complete data ownership and no cloud dependencies. Monitor Types - Web & Network: HTTP/HTTPS, TCP, Ping (ICMP), DNS - Application & Infrastructure: Push webhooks, Docker containers, gRPC, SNMP - Databases & Caches: PostgreSQL, Microsoft SQL Server, MongoDB, Redis - Messaging & Streaming: MQTT Broker, RabbitMQ, Kafka Producer Alert Channels - Email & Webhooks: SMTP, custom webhooks - Chat & Collaboration: Telegram, Slack, Google Chat, Signal, Mattermost, Matrix, Discord, WeCom, WhatsApp - On-Call & Incident: PagerDuty, Opsgenie, Grafana OnCall - Mobile Push & Self-Hosted: NTFY, Gotify, Pushover Status Pages - Public branded status pages showing uptime and performance metrics - Customizable branding and metrics display API-First Design - REST API with Swagger/OpenAPI documentation - Modular architecture for easy extension - Pluggable storage backends (PostgreSQL, MongoDB, SQLite) Core Technologies - Backend: Go (Golang) for high-performance monitoring - Frontend: React + TypeScript for admin dashboard and status pages - Deployment: Official Docker images with docker-compose support - Storage Options: PostgreSQL, MongoDB, or SQLite for flexible setups Peekaping is MIT-licensed and completely free for both personal and commercial use. It offers a modern alternative to proprietary uptime monitoring services while maintaining full data privacy and control.

Self-hosted uptime monitoring with multi-region probes
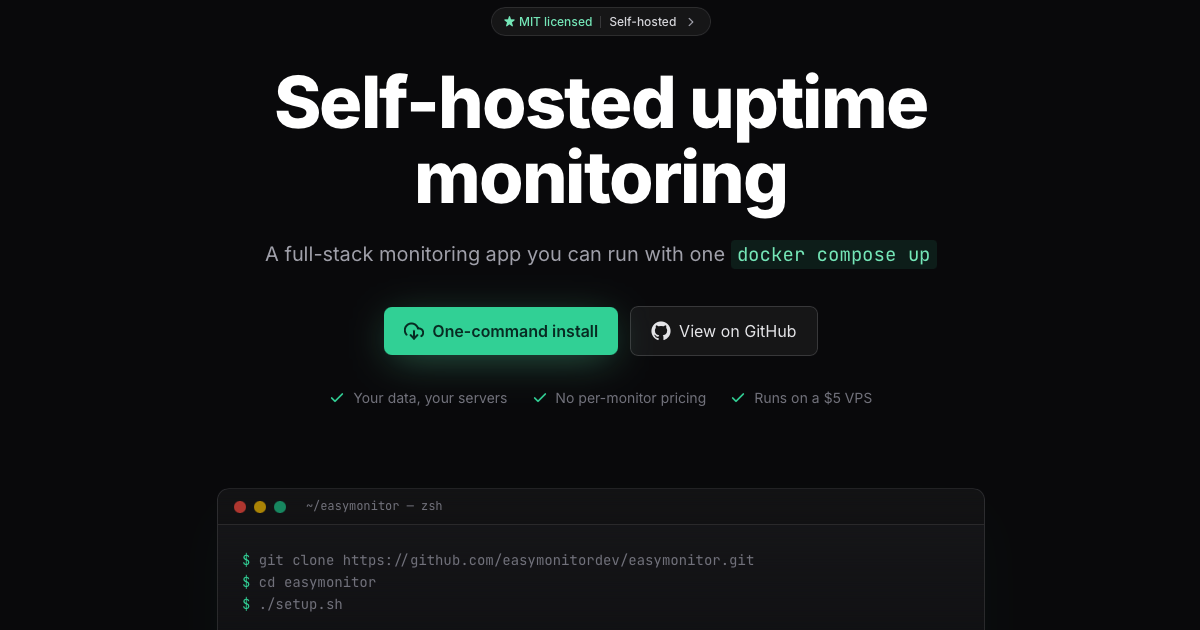
EasyMonitor is an open-source, self-hosted uptime monitoring solution that uses multi-region probes and quorum-based alerts to eliminate false positives. Deploy with a single docker compose up and gain full control over your monitoring data. - Multi-region probes: Deploy lightweight Go probes on any server you own via Tailscale, Cloudflare Tunnel, or VPN - Quorum-based alerts: Cross-probe voting eliminates false alarms from single flaky vantage points - Unlimited monitors: No tier caps or per-monitor pricing—just unlimited monitoring on your hardware - Multi-channel alerts: Email, Pushover, Slack, Discord, and webhooks with per-user channel preferences - Custom status pages: Public, unlisted, or private pages with custom domains, themes, and auto-HTTPS - TimescaleDB integration: Automatic compression (90%+ smaller) and configurable retention for scalable time-series data - Teams & projects: Role-based permissions and per-user notification preferences - One-command install: Interactive setup with automatic DNS configuration and secret generation - Stack: Laravel 12 (PHP 8.4), PostgreSQL 18, TimescaleDB 2.26, Redis 7 Streams, Go 1.24 probes - Deployment: Single Docker Compose setup with Caddy for automatic TLS - Hardware requirements: ~2GB RAM for basic use, $5 VPS sufficient for hundreds of monitors - License: MIT - Probe binary: ~10MB lightweight Go binary deployable anywhere Why self-host? SaaS monitoring vendors can become blind spots during their own outages. EasyMonitor puts the watcher under your control with unlimited monitors, custom domains, and enterprise-grade features at no cost.
About Cronitor
Monitoring made for developers
Cronitor provides status, uptime, and performance monitoring for agents, cron jobs, websites, APIs, and everything in between. Get instant alerts when something breaks, track metrics, and ensure your systems run smoothly.
Key Features of Cronitor
- Cron Job Monitoring: Track scheduled jobs, background workers, and agent tasks. Detect failures, late runs, or missed executions.
- Uptime & Performance Checks: Monitor websites and APIs from 12+ global locations. Test availability, performance, and SSL certificates.
- Heartbeat Monitoring: Send heartbeats from any service, device, or agent to detect unexpected activity or downtime.
- Status Pages: Create public or private status pages to communicate uptime and incidents to customers.
- Real User Monitoring: Track website traffic, errors, and performance with cookie-free analytics.
- Instant Alerts: Receive detailed alerts via Slack, PagerDuty, Email, SMS, and more when issues occur.
- AI Agent Monitoring: Integrate with SDKs or follow the AI agent monitoring guide for seamless tracking.
- Global Monitoring: Choose monitoring locations that matter most for your infrastructure.
Tech / Self-Hosting
Cronitor is a fully managed SaaS solution with no self-hosting required. It offers robust APIs and SDKs for integration with existing workflows and tools.