7 Best Open Source Bugsnag Alternatives
A curated collection of the 7 best open source and self-hosted alternatives to Bugsnag in 2026.
Looking for a free, privacy-friendly, or self-hosted replacement for Bugsnag in 2026? The top open-source alternative is PostHog — Self-driving product analytics platform.
Other highly rated open-source Bugsnag alternatives include Sentry, SigNoz and HyperDX.

Self-driving product analytics platform
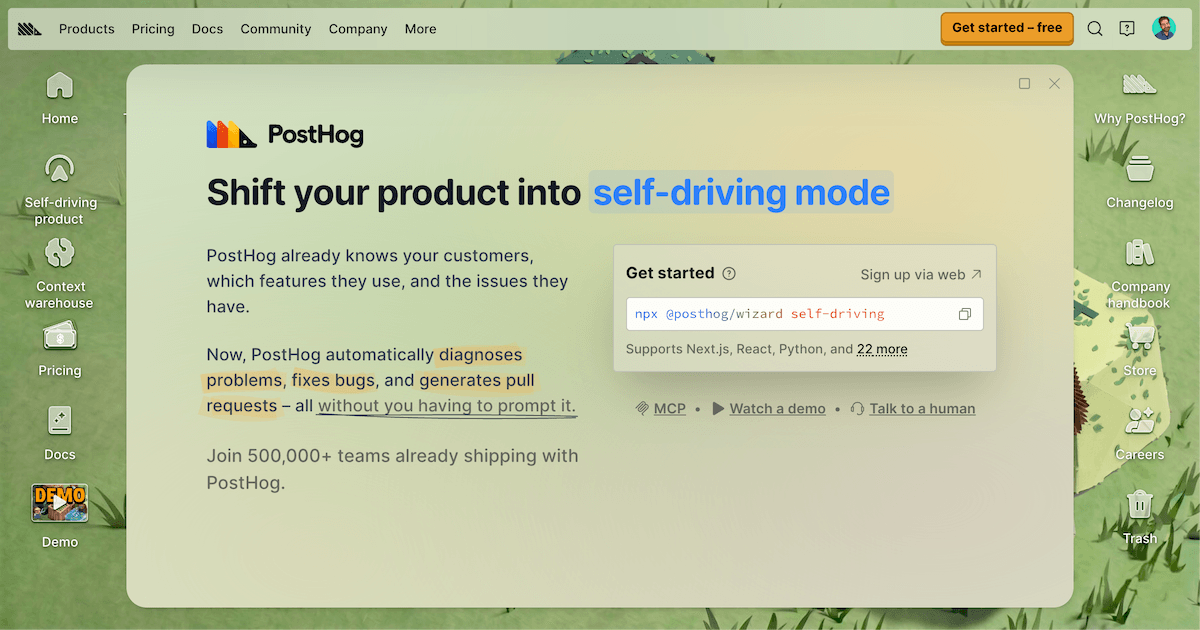
PostHog is an all-in-one product analytics platform that transforms how teams understand and improve their products. By automatically diagnosing problems, fixing bugs, and generating pull requests, PostHog enables teams to work smarter and ship faster. - Automated Issue Detection: Identifies bugs and issues in your product automatically - AI-Powered Fixes: Generates pull requests to resolve detected problems - Context Warehouse: Centralized data warehouse for all product and customer data - Built-in Analytics Tools: Includes product analytics, web analytics, session replay, feature flags, experiments, surveys, and error tracking - AI Observability: Monitor and optimize AI model performance within your product - Self-Hosting Capabilities: Deploy PostHog on your own infrastructure - Slack Integration: Collaborate and triage issues directly from Slack - Managed Warehouse: Cloud-hosted data warehouse option available - No-Code A/B Testing: Run experiments without writing code - Heatmaps & Replay Vision: Visualize user interactions and behavior - CDP (Customer Data Platform): Unify customer data across sources - Traces & Endpoints: Monitor API performance and integrations PostHog is open-source and can be self-hosted on your own infrastructure. It supports deployment on various cloud providers and on-premises environments. The platform is built with Python and JavaScript, using PostgreSQL as its primary database. Comprehensive documentation is available for self-hosting configurations and best practices. View deployment options

Error tracking and performance monitoring for developers
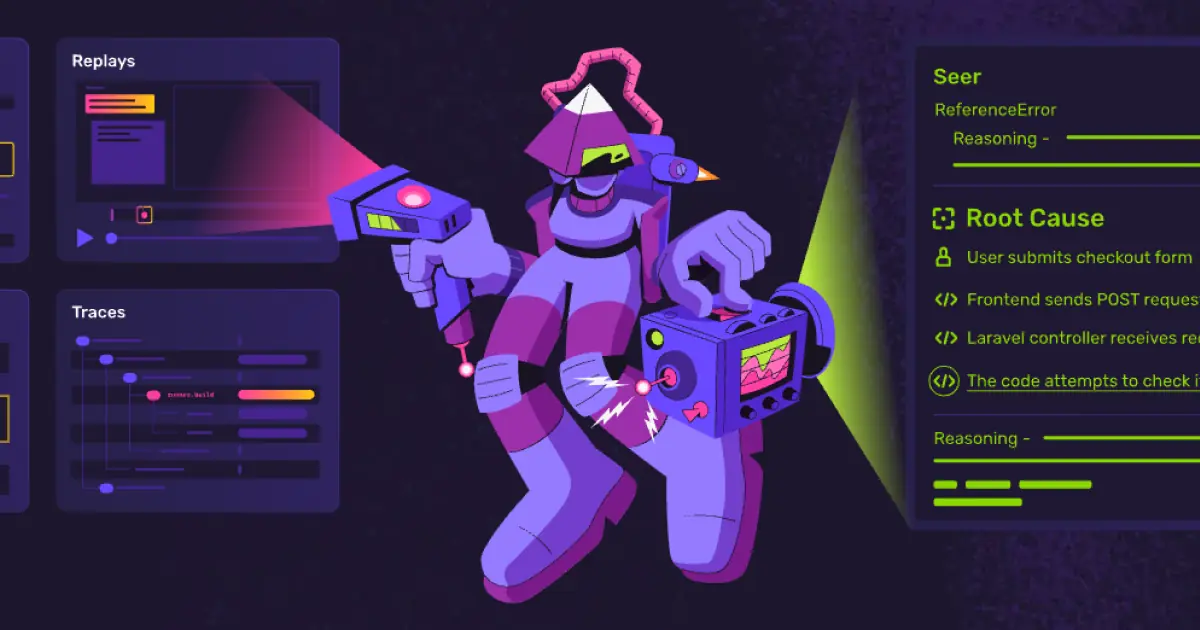
Sentry is a comprehensive error tracking and application performance monitoring (APM) platform designed for developers and software teams. It provides real-time visibility into errors, crashes, and performance bottlenecks across web, mobile, and backend applications. - Error Monitoring: Real-time error tracking with detailed stack traces and context - Performance Monitoring: Application performance insights with tracing and profiling - Session Replay: Visualize user sessions to reproduce and debug issues - AI-Powered Debugging: Seer AI agent for automated issue resolution and code review - Metrics & Monitoring: Custom metrics and uptime monitoring for proactive issue detection - Multi-Platform Support: SDKs for web, mobile, game, and AI applications - Integrations: Native integrations with GitHub, Slack, and other development tools - OpenTelemetry Support: Compatibility with OpenTelemetry standards Sentry offers both cloud-hosted and self-hosted options. The self-hosted version can be deployed on-premises or in private cloud environments, with support for Docker and Kubernetes. The open-source core provides full functionality, while enterprise features are available in paid plans.

Open-source Datadog alternative for full-stack observability
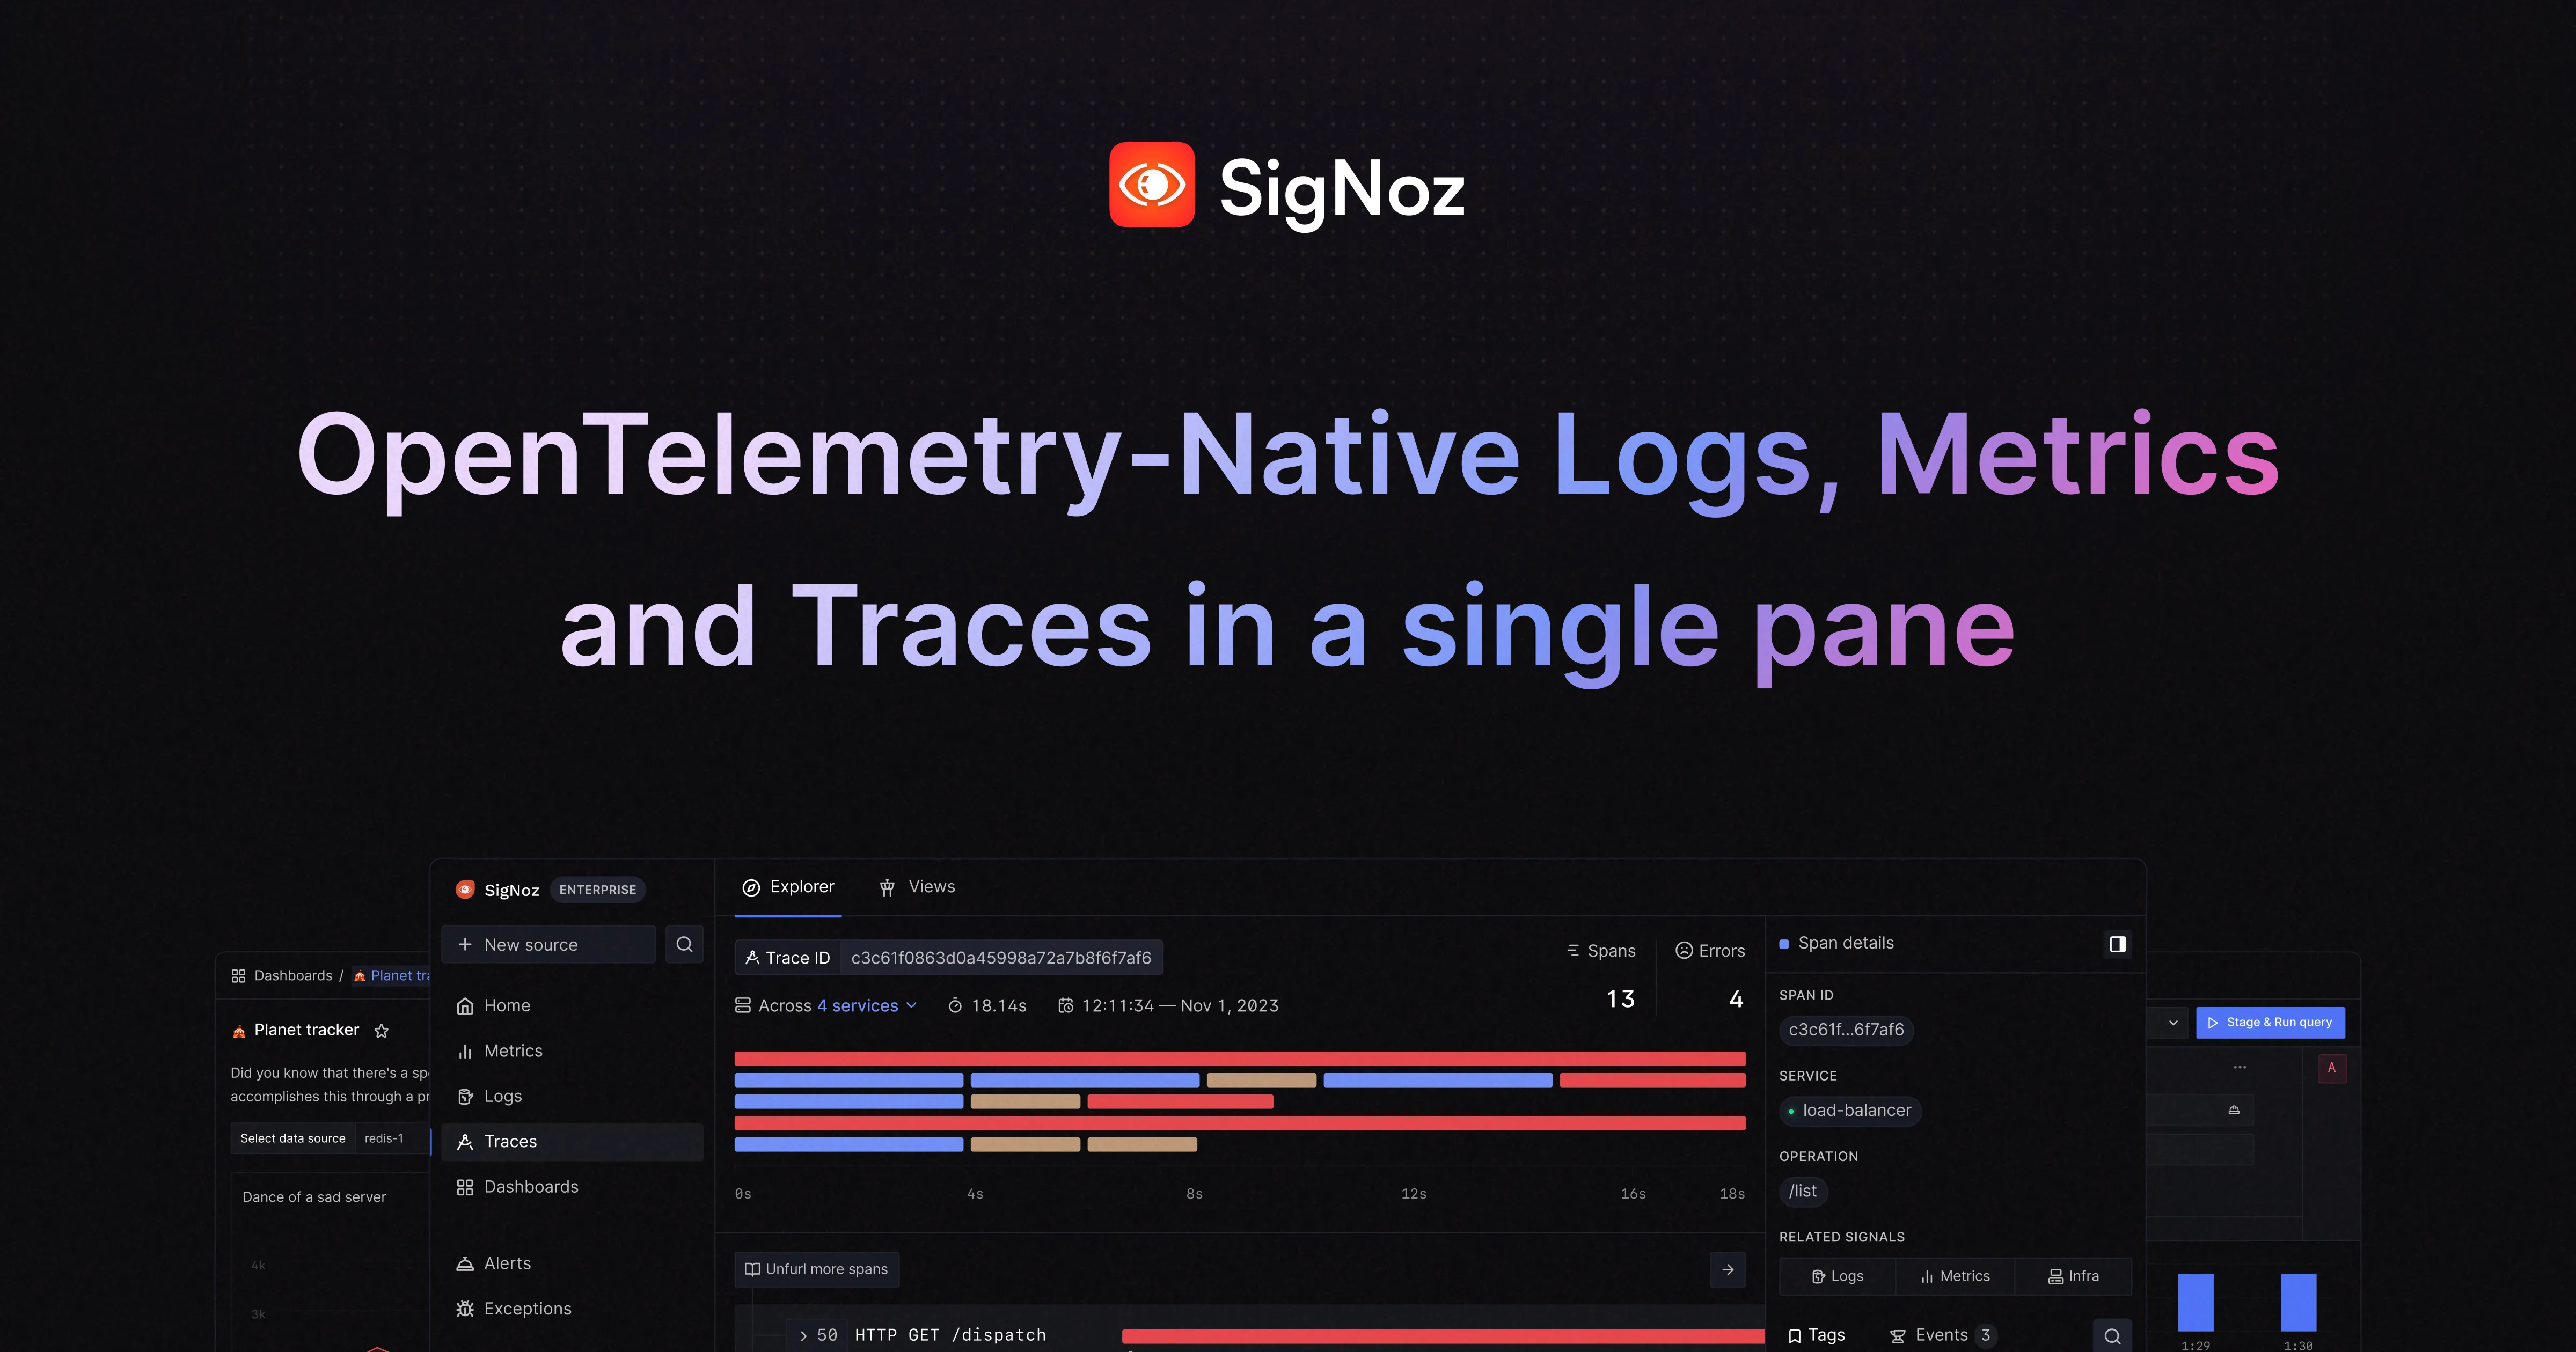
SigNoz is a modern observability platform designed to simplify monitoring, logging, and tracing for applications and AI agents. Built on open standards like OpenTelemetry, it consolidates APM, logs, metrics, exceptions, and AI observability into a single tool. - Full-Stack Observability: Monitor traces, metrics, logs, and exceptions in one platform - OpenTelemetry Native: Built on OpenTelemetry standards for vendor-neutral instrumentation - AI Observability: Specialized tools for monitoring AI agents and applications - Real-Time Alerts: Configurable alerting for anomalies and critical events - Unified Dashboard: Single interface for all observability data - Usage-Based Pricing: Simple, predictable pricing model - Self-Hosting: Deploy on your own infrastructure with Self-Hosted SigNoz - Agent-Native: Optimized for monitoring AI agents and their workflows SigNoz offers both cloud-hosted and self-hosted options. The self-hosted version can be deployed using Docker, Kubernetes, or Helm charts. It supports various data sources and integrates seamlessly with existing monitoring setups. The platform is designed for scalability and can handle high-volume telemetry data from distributed systems.

Open source observability platform for logs, traces and errors
HyperDX is an open source observability platform designed to help engineering teams resolve production issues faster. It unifies session replays, logs, traces, metrics, and errors into a single interface, eliminating the need for multiple tools. - End-to-End Tracing: Automatically trace requests from browser to backend servers and async workers - Blazing Fast Search: Search terabytes of events in seconds using ClickHouse - Intuitive Search Syntax: Simple full-text search without complex syntax requirements - Automatic Pattern Clustering: Aggregate log patterns and condense billions of events into distinctive clusters - Correlated Session Replays: Link session replays with backend logs and traces automatically - Visualization Tools: Build and share intuitive charts for logs, metrics, and traces - Automatic Instrumentation: Trace logs, API requests, DB queries with minimal code - Alerts & Notifications: Get notified via Slack, Email, or PagerDuty when issues occur - Intercom Integration: Jump directly from Intercom to user sessions and logs - Live Tail: View and search log streams in real-time - Native JSON Parsing: Search and graph structured JSON logs without configuration - Vendor Agnostic: Powered by OpenTelemetry for no vendor lock-in - Agent-Free Install: No additional agents, sidecars, or containers required HyperDX is built on ClickHouse and OpenTelemetry, making it highly scalable and compatible with various deployment environments. The platform offers both cloud-hosted and self-hosted options, with automatic instrumentation supporting multiple languages including Node.js, Python, Java, Go, Elixir, and React Native. Deployment is supported on Kubernetes, AWS EC2, Vercel, Fly.io, Heroku, and Cloudflare.
Comprehensive monitoring solution offering error tracking, session replay, and performance insights for seamless debugging and optimization.
Comprehensive monitoring solution offering error tracking, session replay, and performance insights for seamless debugging and optimization.

OpenTelemetry-native observability platform
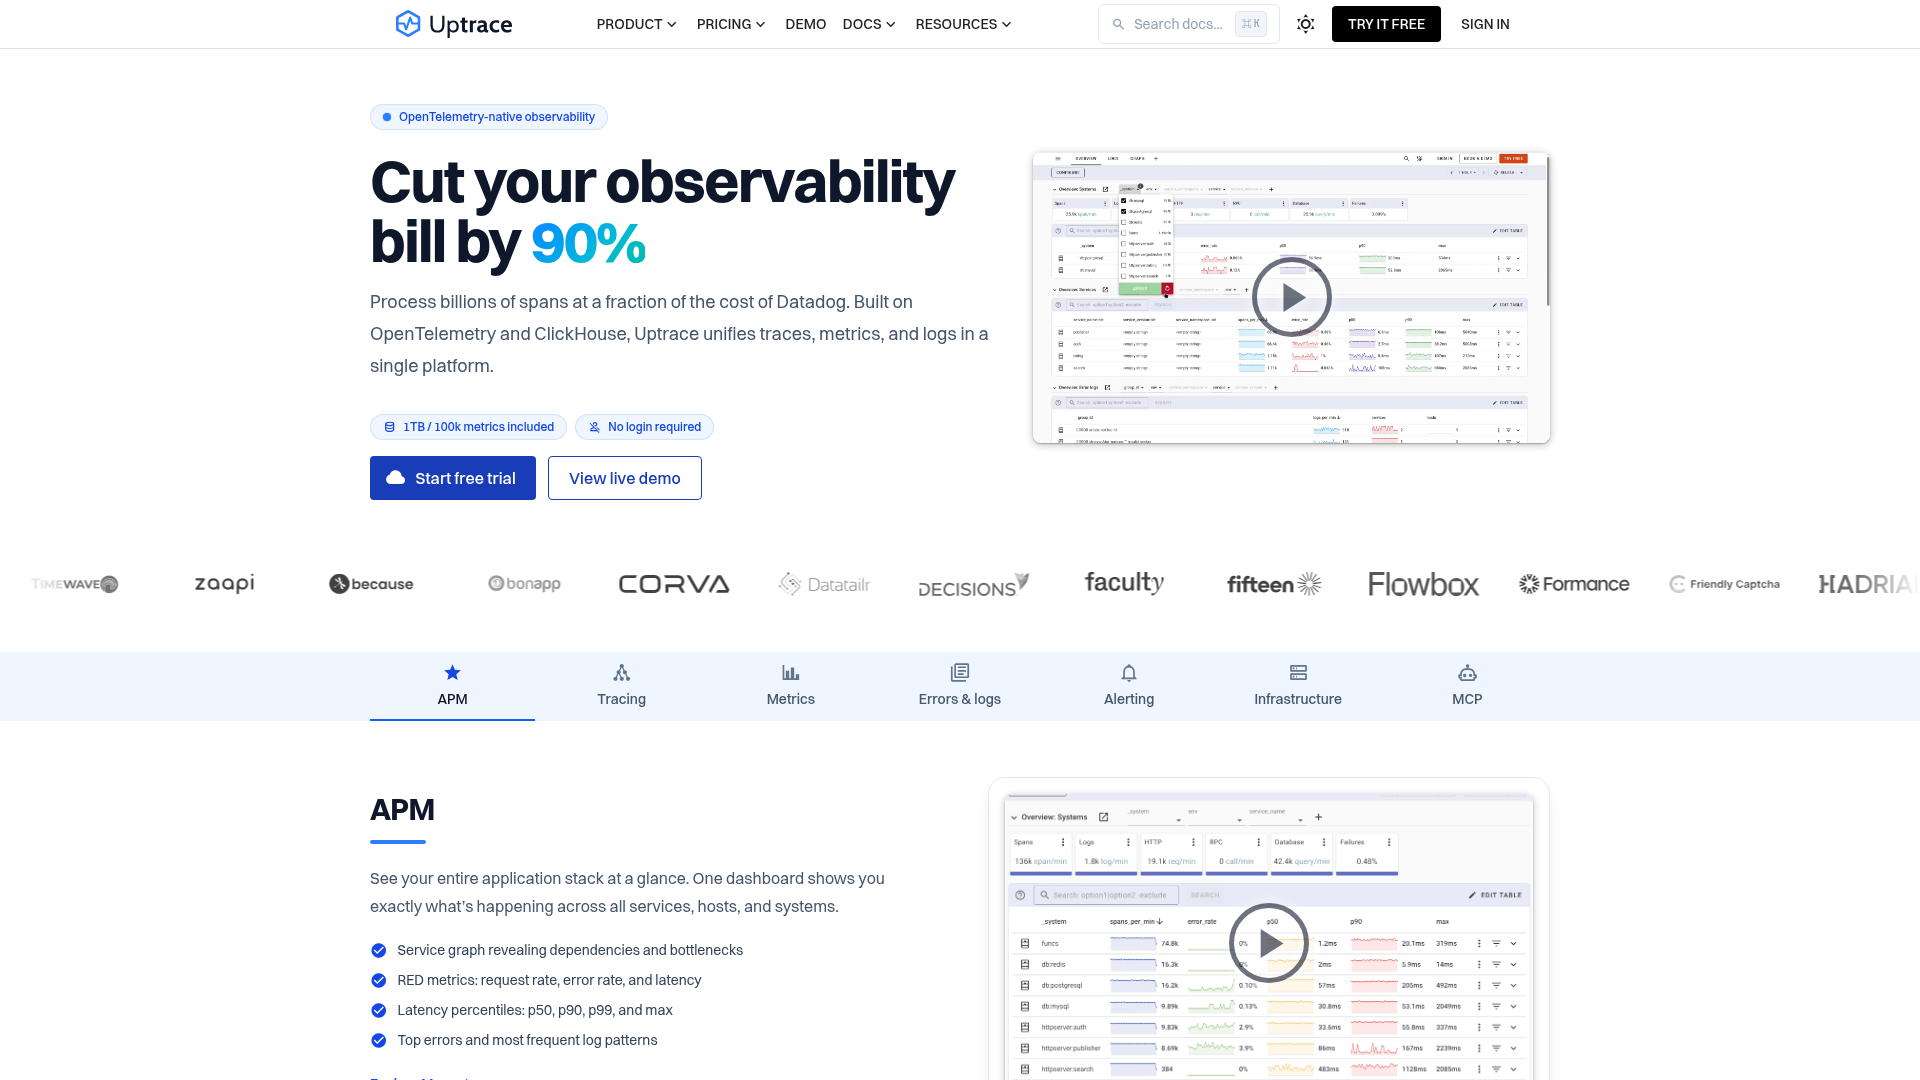
Uptrace is an OpenTelemetry-native observability platform that unifies traces, metrics, and logs in a single platform. Built on OpenTelemetry and ClickHouse, it processes billions of spans at a fraction of the cost of traditional observability tools like Datadog or New Relic. - All-in-one observability: Unified platform for traces, metrics, and logs with no need to stitch data together manually. - OpenTelemetry-native: Ingest data from OpenTelemetry, Prometheus, Vector, FluentBit, CloudWatch, and more. - Cost-effective pricing: Pay per GB ingested and active timeseries with no per-seat fees or hidden charges. - Self-hosting: Download from GitHub and own your data completely with no feature limits. - APM & Infrastructure Monitoring: Service graphs, RED metrics, latency percentiles, and top errors with infrastructure monitoring capabilities. - Alerting & MCP: Built-in alerting and MCP (Model Context Protocol) support for AI-driven observability. - Predictable pricing: Set monthly caps to avoid billing surprises and budget effectively. - Compliance-ready: Offers on-premise installations for organizations with strict compliance requirements. Uptrace is built on OpenTelemetry and ClickHouse, offering both cloud and self-hosted options. The self-hosted version is available as a free download from GitHub, allowing users to deploy on their own infrastructure. Uptrace Cloud provides a fully managed experience with enterprise-grade support and compliance options. The platform is designed to scale from small applications to enterprise-level deployments, handling high-volume data ingestion efficiently.

Self-hosted error tracking for developers
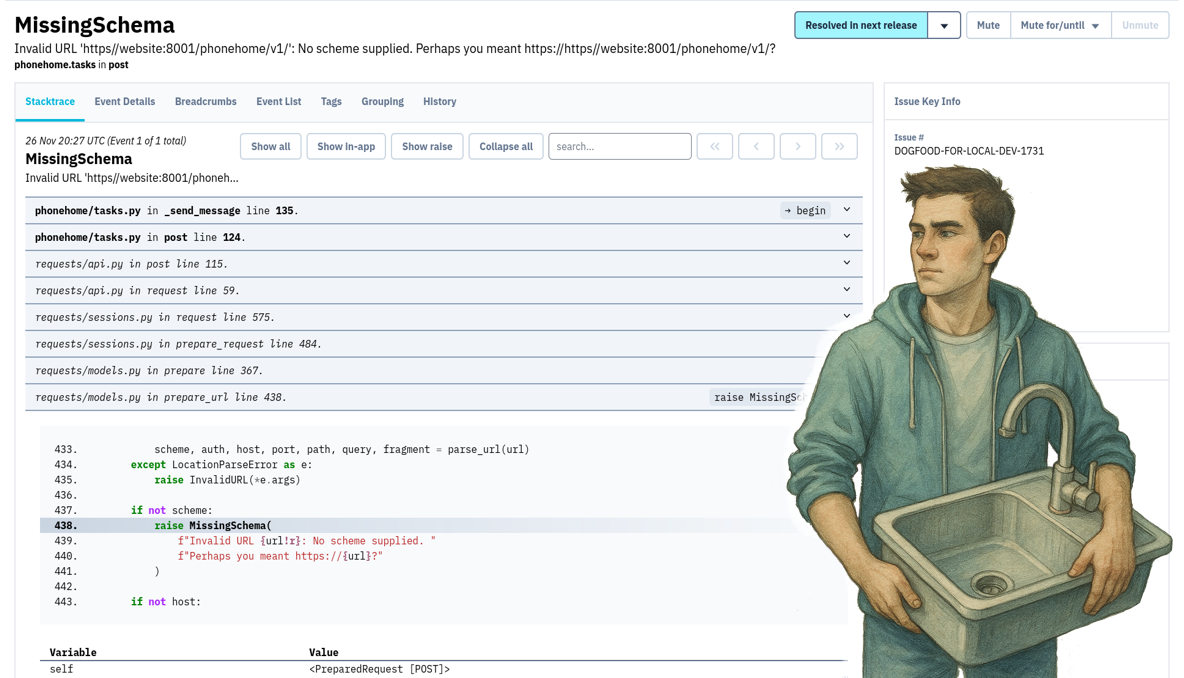
Bugsink provides developers with clear insights into production failures by capturing full stacktraces, local variables, and error context. Designed for self-hosting or managed hosting, it offers Sentry SDK compatibility and predictable pricing at scale. - Full Stacktraces & Local Variables: See exactly why your code failed with complete error context. - Sentry SDK Compatibility: Drop-in replacement for Sentry SDKs across Python, JavaScript, Ruby, PHP, Java, Go, Rust, and more. - Self-Hosting & Managed Hosting: Run on your own servers or use Bugsink’s EU-hosted service with GDPR compliance. - Predictable Costs: No per-event billing; scale to millions of events affordably. - Automatic Issue Grouping: Reduces noise by grouping related errors into manageable issues. - Alerting: Get notified when errors occur via email, Slack, or other integrations. - ARM Compatibility: Works seamlessly on ARM-based servers. - Quick Setup: Deploy in minutes with Docker or Kubernetes. Bugsink is open-source and can be self-hosted on your own infrastructure. It supports Docker and Kubernetes deployments, with detailed installation guides available. The platform is built for scalability and works with existing Sentry SDKs, making migration seamless. For managed hosting, Bugsink offers a GDPR-compliant EU-based service with instant setup and predictable pricing.
About Bugsnag
BugSnag provides real-time error and performance monitoring for mobile and web applications, helping development teams identify, prioritize, and resolve issues faster.
Key Features of Bugsnag
- Error Monitoring: Capture and prioritize bugs by severity with stability scores, pre-configured dashboards, and detailed stack traces to identify root causes quickly.
- Performance Monitoring: Automatically track key metrics like rendering performance, memory consumption, and CPU usage with real user monitoring and OpenTelemetry compatibility.
- Distributed Tracing: Visualize API calls, database queries, and microservice interactions with waterfall graphs and one-click crash-trace correlation.
- Stability Scores: Get immediate snapshots of your app’s health to know when to debug or build features.
- IDE Integration: SmartBear's MCP server brings error data into your IDE with AI-powered fix suggestions.
- Predictable Pricing: Dynamic sampling and burst protection ensure cost control without surprise overages, even during peak traffic.
- Wide Platform Support: Compatible with Android, iOS, JavaScript, React Native, Python, Kotlin, Ruby, Node.js, Java, Unity, and more.
Tech / Self-Hosting
BugSnag is a SaaS-based monitoring solution and does not offer self-hosting options. It is developed and maintained by SmartBear, a company based in the United States.